
User Manual
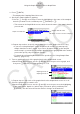
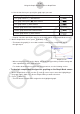
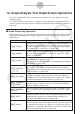
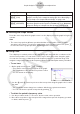
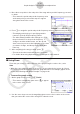
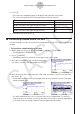
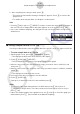
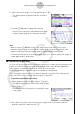
Table Of Contents
- Inhoud
- Eerste kennismaking — Lees dit eerst!
- Hoofdstuk 1 Basisbewerking
- Hoofdstuk 2 Handmatige berekeningen
- 1. Basisberekeningen
- 2. Speciale functies
- 3. De hoekeenheid en weergave van getallen instellen
- 4. Functieberekeningen
- 5. Numerieke berekeningen
- 6. Rekenen met complexe getallen
- 7. Berekeningen met gehele getallen in het twee-, acht-, tien- en zestientallige talstelsel
- 8. Matrixberekeningen
- 9. Vectorberekeningen
- 10. Metrieke omzetting
- Hoofdstuk 3 Lijsten
- Hoofdstuk 4 Vergelijkingen berekenen
- Hoofdstuk 5 Grafieken tekenen
- 1. Voorbeeldgrafieken
- 2. Bepalen wat wordt weergegeven in een grafiekscherm
- 3. Een grafiek tekenen
- 4. Inhoud van het grafiekscherm opslaan en oproepen
- 5. Twee grafieken in hetzelfde scherm tekenen
- 6. Handmatig tekenen
- 7. Tabellen gebruiken
- 8. Een grafiek wijzigen
- 9. Dynamische grafieken tekenen
- 10. Een grafiek tekenen op basis van een recursieformule
- 11. Grafieken van kegelsneden tekenen
- 12. Punten, lijnen en tekst tekenen in het grafiekscherm (Sketch)
- 13. Functieanalyse
- Hoofdstuk 6 Statistische grafieken en berekeningen
- 1. Voor u met statistische berekeningen begint
- 2. Grafieken en berekeningen voor statistische gegevens met één variabele
- 3. Grafieken en berekeningen voor statistische gegevens met twee variabelen (Aanpassing kromme)
- 4. Statistische berekeningen uitvoeren
- 5. Testen
- 6. Betrouwbaarheidsinterval
- 7. Kansverdelingsfuncties
- 8. Invoer- en uitvoertermen van testen, betrouwbaarheidsinterval en kansverdelingsfuncties
- 9. Statistische formule
- Hoofdstuk 7 Financiële berekeningen
- 1. Voor u met financiële berekeningen begint
- 2. Een enkelvoudige interest berekenen
- 3. Een samengestelde interest berekenen
- 4. Evaluatie van een investering (cashflow)
- 5. Afschrijving van een lening
- 6. Omzetting van nominale rentevoet naar reële rentevoet
- 7. Berekening van kosten, verkoopprijs en winstmarge
- 8. Dag- en datumberekeningen
- 9. Devaluatie
- 10. Obligatieberekeningen
- 11. Financiële berekeningen met gebruik van functies
- Hoofdstuk 8 Programmeren
- 1. Basishandelingen voor het programmeren
- 2. Functietoetsen in de modus Program
- 3. De programma-inhoud wijzigen
- 4. Bestandsbeheer
- 5. Overzicht van de opdrachten
- 6. Rekenmachinefuncties gebruiken bij het programmeren
- 7. Lijst met opdrachten in de modus Program
- 8. Wetenschappelijke CASIO-specifieke functieopdrachten <=> Tekstconversietabel
- 9. Programmablad
- Hoofdstuk 9 Spreadsheet
- Hoofdstuk 10 eActivity
- Hoofdstuk 11 Geheugenbeheer
- Hoofdstuk 12 Systeembeheer
- Hoofdstuk 13 Gegevenscommunicatie
- Hoofdstuk 14 Geometry
- Hoofdstuk 15 Picture Plot
- Hoofdstuk 16 3D-grafiek functie
- Hoofdstuk 17 Python (alleen fx-CG50, fx-CG50 AU)
- Hoofdstuk 18 Kansverdeling (alleen fx-CG50, fx-CG50 AU)
- Bijlage
- Examenmodi
- E-CON4 Application (English)
- 1. E-CON4 Mode Overview
- 2. Sampling Screen
- 3. Auto Sensor Detection (CLAB Only)
- 4. Selecting a Sensor
- 5. Configuring the Sampling Setup
- 6. Performing Auto Sensor Calibration and Zero Adjustment
- 7. Using a Custom Probe
- 8. Using Setup Memory
- 9. Starting a Sampling Operation
- 10. Using Sample Data Memory
- 11. Using the Graph Analysis Tools to Graph Data
- 12. Graph Analysis Tool Graph Screen Operations
- 13. Calling E-CON4 Functions from an eActivity

ε-43
Graph Analysis Tool Graph Screen Operations
5. After everything is the way you want, press w.
• This saves the lists and the message “Complete!” appears. Press w to return to the
graph screen.
• For details about using list data, see Chapter 3 of this manual.
Note
• Pressing 1(All) in place of 2(SELECT) in step 2 converts the entire graph to list data. In
this case, the “Store Sample Data” dialog box appears as soon as you press 1(All).
• In the case of Manual Sampling, the dialog box in step 4 of the procedure will appear as
shown below.
k Saving Sample Data to a CSV File
Use the procedure below to save the sample data in the specific range of a graph to a CSV file.
• To save sample data to a CSV file
1. On the graph screen, press K2(MEMORY)2(CSV).
• This displays the CSV menu at the bottom of the display.
2. Press 1(SAVE
•
AS)2(SELECT).
• This will display a trace point for specifying a range on the graph.
3. Move the trace point to the start point of the range you want to save to a CSV file, and
then press w.
4. Move the trace point to the end point of the range you want to save to a CSV file, and then
press w.
• This displays the folder selection screen.
5. Select the folder where you want to save the CSV file.
6. Press 1(SAVE
•
AS).
7. Input up to 8 characters for the file name and then press w.
Note
• To select all of the graph data and save it as CSV data, press 1(All) in place of
2(SELECT) in step 2 above. The folder selection screen will appear as soon as you
press 1(All).
• If there are multiple graphs on the graph screen, use f and c to select the graph you
want and then press w. (Not included on the Manual Sampling)