
User Manual
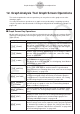
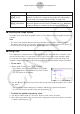
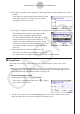
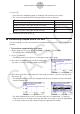
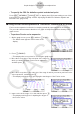
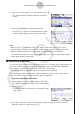
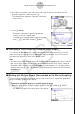
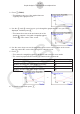
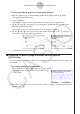
Table Of Contents
- 目录
- 介绍 — 请首先阅读这一部分!
- 第1章 基本操作
- 第2章 手动计算
- 第3章 列表功能
- 第4章 方程计算
- 第5章 绘图
- 第6章 统计图形与计算
- 第7章 财务计算
- 第8章 编程
- 第9章 数据表格
- 第10章 eActivity
- 第11章 存储器管理器
- 第12章 系统管理器
- 第13章 数据通信
- 第14章 几何
- 第15章 教学探索
- 第16章 3D图形函数
- 第17 章 Python(仅限fx-CG50)
- 第18章 分布(仅限fx-CG50)
- 附录
- 考试模式
- E-CON4 Application (English)
- 1. E-CON4 Mode Overview
- 2. Sampling Screen
- 3. Auto Sensor Detection (CLAB Only)
- 4. Selecting a Sensor
- 5. Configuring the Sampling Setup
- 6. Performing Auto Sensor Calibration and Zero Adjustment
- 7. Using a Custom Probe
- 8. Using Setup Memory
- 9. Starting a Sampling Operation
- 10. Using Sample Data Memory
- 11. Using the Graph Analysis Tools to Graph Data
- 12. Graph Analysis Tool Graph Screen Operations
- 13. Calling E-CON4 Functions from an eActivity

ε-46
Graph Analysis Tool Graph Screen Operations
4. Move the trace pointer to the end point of the range for which you want to perform
quadratic regression, and then press w.
• This displays the quadratic regression calculation
result screen.
5. Press 6(DRAW).
• This draws a quadratic regression graph and
overlays it over the original graph.
• To delete the overlaid quadratic regression graph,
press !4(SKETCH) and then 1(Cls).
k Overlaying a Y=f(x) Graph on a Sampled Result Graph
You can use the E-CON4 mode to graph equations based on the form Y=f(x). From the
graph screen, press K5(Y=fx) to display the graph relation list screen. From there,
operations are identical to those in the Graph mode.
Note
• The data on the graph relation list screen is shared with the Graph mode. Note, however,
that only Y= type graphs can be used in the E-CON4 mode. Because of this, calling up
the graph relation list screen from the E-CON4 mode will display a “Y” (Y= type) item for
function menu key 3. Also, 5(MODIFY) is not displayed, because it is not used in the
E-CON4 mode.
k Working with Multiple Graphs (Not included on the Manual Sampling)
The procedures in this section explain how you can zoom or move a particular graph when
there are multiple graphs on the display.
• To zoom a particular graph on a multi-graph display
1. When the graph screen contains multiple graphs, press K, and then 3(EDIT).
• The EDIT menu appears at the bottom of the display.