
User Manual
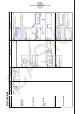
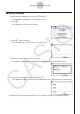
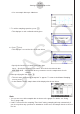
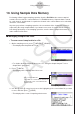
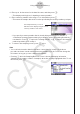
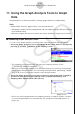
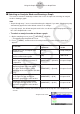
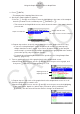
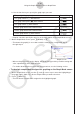
Table Of Contents
- 目录
- 介绍 — 请首先阅读这一部分!
- 第1章 基本操作
- 第2章 手动计算
- 第3章 列表功能
- 第4章 方程计算
- 第5章 绘图
- 第6章 统计图形与计算
- 第7章 财务计算
- 第8章 编程
- 第9章 数据表格
- 第10章 eActivity
- 第11章 存储器管理器
- 第12章 系统管理器
- 第13章 数据通信
- 第14章 几何
- 第15章 教学探索
- 第16章 3D图形函数
- 第17 章 Python(仅限fx-CG50)
- 第18章 分布(仅限fx-CG50)
- 附录
- 考试模式
- E-CON4 Application (English)
- 1. E-CON4 Mode Overview
- 2. Sampling Screen
- 3. Auto Sensor Detection (CLAB Only)
- 4. Selecting a Sensor
- 5. Configuring the Sampling Setup
- 6. Performing Auto Sensor Calibration and Zero Adjustment
- 7. Using a Custom Probe
- 8. Using Setup Memory
- 9. Starting a Sampling Operation
- 10. Using Sample Data Memory
- 11. Using the Graph Analysis Tools to Graph Data
- 12. Graph Analysis Tool Graph Screen Operations
- 13. Calling E-CON4 Functions from an eActivity

ε-36
Using the Graph Analysis Tools to Graph Data
k Selecting an Analysis Mode and Drawing a Graph
This section contains a detailed procedure that covers all steps from selecting an analysis
mode to drawing a graph.
Note
• Step 4 through step 7 are not essential and may be skipped, if you want. Skipping any step
automatically applies the initial default values for its settings.
• If you skip step 2, the default analysis mode is the one whose name is displayed in the top
line of the Graph Mode screen.
• To select an analysis mode and draw a graph
1. On the sampling screen, press 4(OTHER)1(GRAPH).
• This displays the Graph Mode screen.
2. Press 3(MODE), and then select the analysis mode you want from the menu that
appears.
To do this:
Perform this menu
operation:
To select this
mode:
Graph three sets of sampled data
simultaneously
[Norm] Graph Analysis
Graph sampled data along with its first
and second derivative graph
[diff] d/dt & d
2
/dt
2
Display the graphs of different sampled
data in upper and lower windows for
comparison
[COMPARE] → [GRAPH]
Compare Graph
Output sampled data from the speaker,
displaying graph of the raw data in
the upper window and the output
waveform in the lower window (EA-200
only)
[COMPARE] → [Sound]
Compare Sound
Display the graph of sampled data
in the upper window and its first
derivative graph in the lower window
[COMPARE] → [d/dt]
Compare d/dt
Display the graph of sampled data
in the upper window and its second
derivative graph in the lower window
[COMPARE] → [d
2
/dt
2
]
Compare d
2
/dt
2
• The name of the currently selected mode appears in the top line of the Graph Mode
screen.
Analysis mode name