
User Manual

16-12
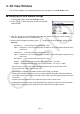
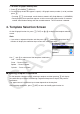
2. Select the zoom operation you want.
!2(Zoom)1(IN) … Zooms in on the screen center.
2(OUT) … Zooms out from the screen center.
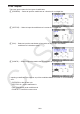
3(VIEW-X) … Displays the view along the positive
x-axis.
4(VIEW-Y) … Displays the view along the positive
y-axis.
5(VIEW-Z) … Displays the view along the positive
z-axis.
6(ORIGINAL) … Returns the 3D graph to its original (unrotated,
unzoomed) state.
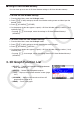
Sketch Functions
You can insert point and write text into a 3D graph.
1. Draw a 3D graph.
2. As required, use the setup screen to configure the settings below.
Plot/LineCol ... Specifies the initial default color for inserted points and text.
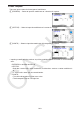
3. Select the sketch operation you want.
!4(SKETCH)1(Cls) … Clears plotted points and written text.
2(Plot) … Plots a point.
3(Text) … Inserts text.
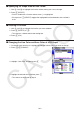
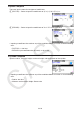
4. Use the cursor keys to move the pointer
( ) to the location you want.
5. To plot a point: Press w.
To insert text: Input a text string.
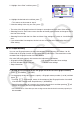
Analyzing a 3D Graph (G-SOLVE Menu)
You can display a vertical plane on the x-axis, y-axis, or z-axis to emphasize a cross section
(the location where the plane and the 3D graph overlap).
k
•
k