
User Manual

16-3
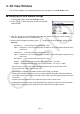
2. 3D View Window
The 3D View Window is for configuring settings that are specific to the 3D Graph mode.
Configuring 3D View Window Settings
1. From the Main Menu, enter the 3D Graph mode.
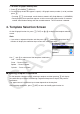
2. Press !3(V-WIN) to display the 3D View Window
setting screen.
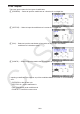
3. Use f and c to move the highlighting to the item whose setting you want to change,
enter the appropriate value, and then press w.
4. After correctly configuring settings, press J to close the 3D View Window setting screen.
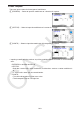
Settings
Xmin/Xmax ...
x-axis minimum value/maximum value
Xgrid ... Number of
x-axis calculation points (number of calculation points between Xmin
and Xmax)
Ymin/Ymax ...
y-axis minimum value/maximum value
Ygrid ... Number of
y-axis calculation points (number of calculation points between Ymin
and Ymax)
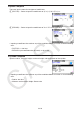
Zmin/Zmax ...
z-axis minimum value/maximum value
Angle
θ
... Angle of clockwise rotation of the x-axis (−180° <
θ
< 180°)
Angle
φ
... Angle between 3D graph line of sight and the z-axis (0° <
φ
< 360°)
Input min/max values in the range where the absolute value is smaller than 1E97.
Input a grid value in the range 2
< grid < 50.
Input
θ
and
φ
in degrees, regardless of the current angle unit setting.
The greater the Xgrid and Ygrid values, the more detailed the graph. Also note, however,
that larger values require more calculation, which means that the graphing operation takes
more time.
Graphing may be impossible if the Xgrid and Ygrid values are too small.
Depending on the form of the 3D graph being drawn, Xgrid and Ygrid may be the number
of divisions of the graph itself rather than the number drawing range divisions.
k
•
•
•
•
•
•