
User Manual

16-2
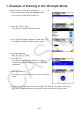
1. Example of Drawing in the 3D Graph Mode
Example to draw a 3D graph of the sphere (x
2
+ y
2
+ z
2
= 2
2
)
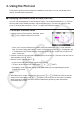
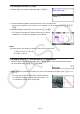
1. From the Main Menu, enter the 3D Graph mode.
This displays the 3D graph function list. •
2. Press 3(TYPE) or d/e.
This displays a template selection screen. •
3. Press cc to highlight “Sphere” and then press w.
This displays the Sphere coefficient input screen.
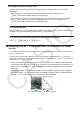
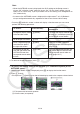
4. Input the coefficients.
awawawcw
5. Press 6(SET).
This returns to the 3D graph function list. The list
will show the selected template name and the input
coefficients.
•
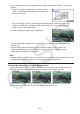
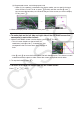
6. Press 6(DRAW) or w.
This displays the 3D graph screen and draws a sphere
graph.
•
To return to the 3D graph function list, press A. After drawing a 3D graph, each press of
!6(G⇔T) toggles between the 3D graph function list and the 3D graph screen.
•