
User Manual


17-19
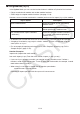
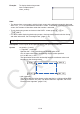
Example: To display the drawing screen
from casioplot import *
show_screen()
Note:
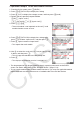
The above shows an example in which a blank screen with nothing drawn on it is displayed •
when
show_screen is executed from the SHELL screen. If something is already drawn on the
screen, that content will be shown when the function is executed.
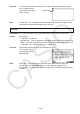
To exit the drawing screen and return to the SHELL screen, press • J, A, or
!J(QUIT).
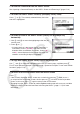
For details about displaying the drawing screen, drawing screen refresh and clear timing, •
and other information, see “Drawing Screen” (page 17-22).
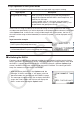
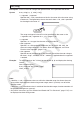
set_pixel()
Description: Draws a pixel of the specified color at the specified coordinates.
Syntax: set_pixel(x, y[, color])
x• argument, y argument
Specifies the x- and y-coordinates of the pixel to be drawn.
Only int type values within the following ranges can be specified:
0 < x < 383, 0 < y < 191.
The figure below shows the relationship between coordinate values and
locations on the drawing screen.
(0, 0)
(383, 0)
(383, 191)
(0, 191)
color argument•
The color of the pixel to be drawn can be specified as a 256-gradation RGB
value (0, 0, 0 to 255, 255, 255). For details about this argument, see “Draw
Function color Argument” (page 17-22).