
User Manual


5-26
• Visse funksjoner kan fremstilles grafisk på en enkel måte ved å bruke innebygde
funksjonsgrafer.
• Du kan tegne grafene til følgende innebygde vitenskapelige funksjoner.
Rektangulær koordinatgraf Polar koordinatgraf
• sin x • cos x • tan x • sin
−1
x
• cos
−1
x • tan
−1
x • sinh x • cosh x
• tanh x • sinh
−1
x • cosh
−1
x • tanh
−1
x
• 'x • x
2
• log x • ln x
• 10
x
• e
x
• x
−1
•
3
'x
• • •
• sin
θ
• cos
θ
• tan
θ
• sin
−1
θ
• cos
−1
θ
• tan
−1
θ
• sinh
θ
• cosh
θ
• tanh
θ
• sinh
−1
θ
• cosh
−1
θ
• tanh
−1
θ
• '
θ
•
θ
2
• log
θ
• ln
θ
• 10
θ
• e
θ
•
θ
−1
•
3
'
θ
- Input for variablene x og
θ
er ikke nødvendig for innebygde funksjoner.
- Andre operatorer eller verdier kan ikke skrives inn ved bruk av innebygde funksjoner.
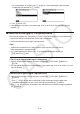
• Graftegne en parametrisk funksjon
Kalkulatoren din kan tegne en parametrisk funksjon representert med (X, Y) = (f(T), g(T)).
Eksempel For å graftegne med funksjonsparametrene under
x = 7cosT − 2cos3,5T y = 7sinT − 2sin3,5T
Bruk følgende V-Window-innstillinger.
Xmin = −20, Xmax = 20, Xscale = 5
Ymin = −12, Ymax = 12, Yscale = 5
T
θ
min = 0, T
θ
max = 4
π
, T
θ
ptch =
π
÷ 36
Velg «Param» for «Func Type» og «Rad» for «Angle» i Setup-skjermbildet.
1 m Run-Matrix
2 !m(SET UP)2(Line)ccc3(Param)ccc2(Rad)J
3 !3(V-WIN) -cawcawfwc
-bcwbcwfw
awe!5(
π
)w!5(
π
)/dgwJ
4 !4(SKETCH)1(Cls)w
5(GRAPH)3(Param)
5 hcv-ccd.fv,
hsv-csd.fvw
dx
(
x
)
d
dx
2
(
x
)
d
2
∫(
x
)
dx