
User Manual

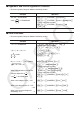


Table Of Contents
- Contents
- Getting Acquainted — Read This First!
- Chapter 1 Basic Operation
- Chapter 2 Manual Calculations
- 1. Basic Calculations
- 2. Special Functions
- 3. Specifying the Angle Unit and Display Format
- 4. Function Calculations
- 5. Numerical Calculations
- 6. Complex Number Calculations
- 7. Binary, Octal, Decimal, and Hexadecimal Calculations with Integers
- 8. Matrix Calculations
- 9. Vector Calculations
- 10. Metric Conversion Calculations
- Chapter 3 List Function
- Chapter 4 Equation Calculations
- Chapter 5 Graphing
- 1. Sample Graphs
- 2. Controlling What Appears on a Graph Screen
- 3. Drawing a Graph
- 4. Saving and Recalling Graph Screen Contents
- 5. Drawing Two Graphs on the Same Screen
- 6. Manual Graphing
- 7. Using Tables
- 8. Modifying a Graph
- 9. Dynamic Graphing
- 10. Graphing a Recursion Formula
- 11. Graphing a Conic Section
- 12. Drawing Dots, Lines, and Text on the Graph Screen (Sketch)
- 13. Function Analysis
- Chapter 6 Statistical Graphs and Calculations
- 1. Before Performing Statistical Calculations
- 2. Calculating and Graphing Single-Variable Statistical Data
- 3. Calculating and Graphing Paired-Variable Statistical Data (Curve Fitting)
- 4. Performing Statistical Calculations
- 5. Tests
- 6. Confidence Interval
- 7. Distribution
- 8. Input and Output Terms of Tests, Confidence Interval, and Distribution
- 9. Statistic Formula
- Chapter 7 Financial Calculation
- Chapter 8 Programming
- Chapter 9 Spreadsheet
- Chapter 10 eActivity
- Chapter 11 Memory Manager
- Chapter 12 System Manager
- Chapter 13 Data Communication
- Chapter 14 Geometry
- Chapter 15 Picture Plot
- Chapter 16 3D Graph Function
- Appendix
- Examination Mode
- E-CON4 Application (English)
- 1. E-CON4 Mode Overview
- 2. Sampling Screen
- 3. Auto Sensor Detection (CLAB Only)
- 4. Selecting a Sensor
- 5. Configuring the Sampling Setup
- 6. Performing Auto Sensor Calibration and Zero Adjustment
- 7. Using a Custom Probe
- 8. Using Setup Memory
- 9. Starting a Sampling Operation
- 10. Using Sample Data Memory
- 11. Using the Graph Analysis Tools to Graph Data
- 12. Graph Analysis Tool Graph Screen Operations
- 13. Calling E-CON4 Functions from an eActivity
2-20
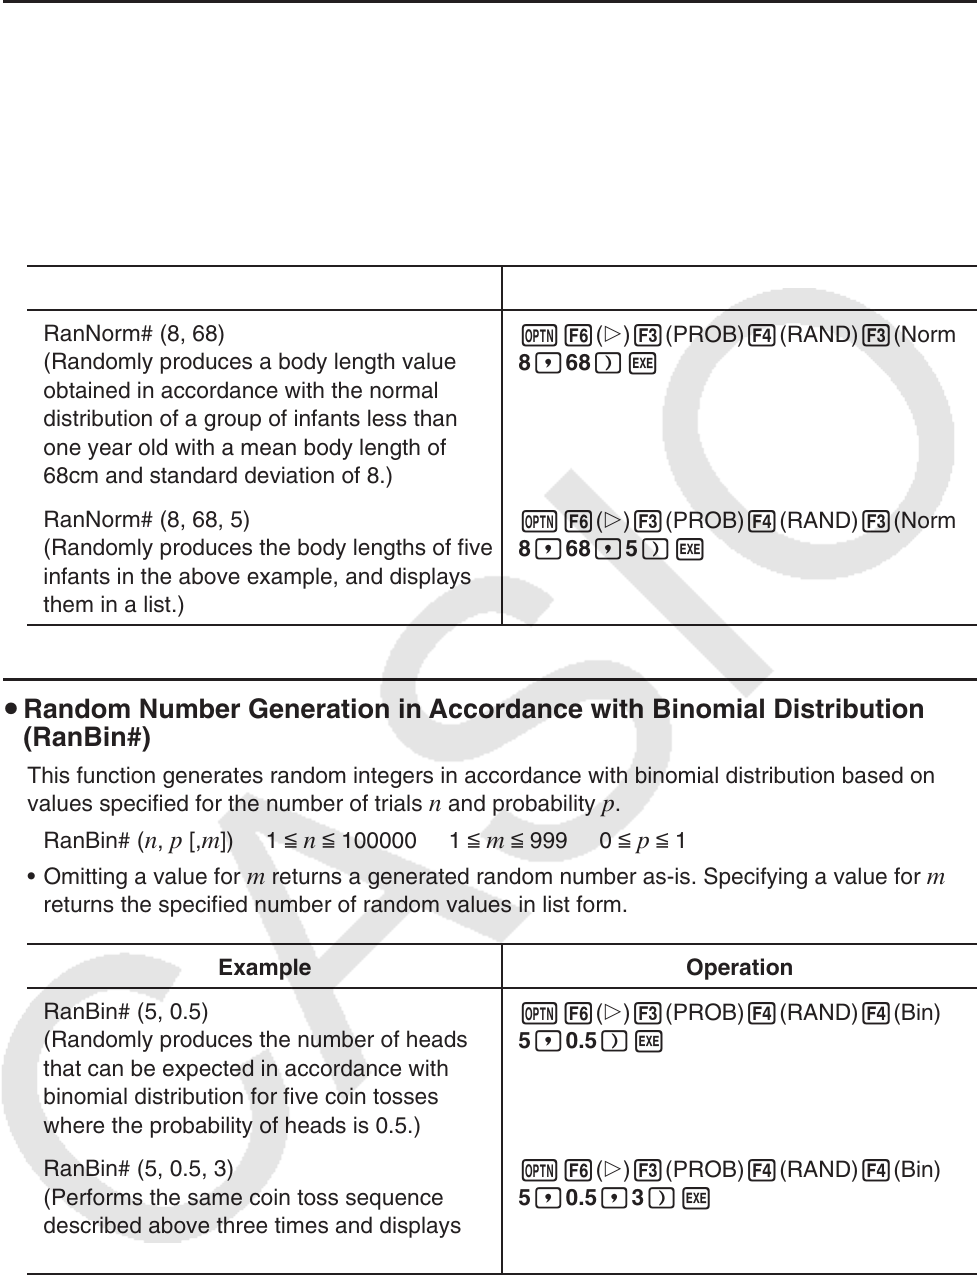
u Random Number Generation in Accordance with Normal Distribution
(RanNorm#)
This function generates a 10-digit random number in accordance with normal distribution
based on a specified mean
and standard deviation values.
RanNorm# (
, [,n]) > 0 1 < n < 999
• Omitting a value for
n returns a generated random number as-is. Specifying a value for n
returns the specified number of random values in list form.
Example Operation
RanNorm# (8, 68)
(Randomly produces a body length value
obtained in accordance with the normal
distribution of a group of infants less than
one year old with a mean body length of
68cm and standard deviation of 8.)
K6(g)3(PROB)4(RAND)3(Norm)
8,68)w
RanNorm# (8, 68, 5)
(Randomly produces the body lengths of five
infants in the above example, and displays
them in a list.)
K6(g)3(PROB)4(RAND)3(Norm)
8,68,5)w
u Random Number Generation in Accordance with Binomial Distribution
(RanBin#)
This function generates random integers in accordance with binomial distribution based on
values specified for the number of trials n and probability p.
RanBin# (
n, p [,m]) 1 < n < 100000 1 < m < 999 0 < p < 1
• Omitting a value for
m returns a generated random number as-is. Specifying a value for m
returns the specified number of random values in list form.
Example Operation
RanBin# (5, 0.5)
(Randomly produces the number of heads
that can be expected in accordance with
binomial distribution for five coin tosses
where the probability of heads is 0.5.)
K6(g)3(PROB)4(RAND)4(Bin)
5,0.5)w
RanBin# (5, 0.5, 3)
(Performs the same coin toss sequence
described above three times and displays
the results in a list.)
K6(g)3(PROB)4(RAND)4(Bin)
5,0.5,3)w