
User Manual
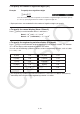

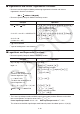
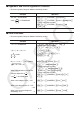


Table Of Contents
- Contents
- Getting Acquainted — Read This First!
- Chapter 1 Basic Operation
- Chapter 2 Manual Calculations
- 1. Basic Calculations
- 2. Special Functions
- 3. Specifying the Angle Unit and Display Format
- 4. Function Calculations
- 5. Numerical Calculations
- 6. Complex Number Calculations
- 7. Binary, Octal, Decimal, and Hexadecimal Calculations with Integers
- 8. Matrix Calculations
- 9. Vector Calculations
- 10. Metric Conversion Calculations
- Chapter 3 List Function
- Chapter 4 Equation Calculations
- Chapter 5 Graphing
- 1. Sample Graphs
- 2. Controlling What Appears on a Graph Screen
- 3. Drawing a Graph
- 4. Saving and Recalling Graph Screen Contents
- 5. Drawing Two Graphs on the Same Screen
- 6. Manual Graphing
- 7. Using Tables
- 8. Modifying a Graph
- 9. Dynamic Graphing
- 10. Graphing a Recursion Formula
- 11. Graphing a Conic Section
- 12. Drawing Dots, Lines, and Text on the Graph Screen (Sketch)
- 13. Function Analysis
- Chapter 6 Statistical Graphs and Calculations
- 1. Before Performing Statistical Calculations
- 2. Calculating and Graphing Single-Variable Statistical Data
- 3. Calculating and Graphing Paired-Variable Statistical Data (Curve Fitting)
- 4. Performing Statistical Calculations
- 5. Tests
- 6. Confidence Interval
- 7. Distribution
- 8. Input and Output Terms of Tests, Confidence Interval, and Distribution
- 9. Statistic Formula
- Chapter 7 Financial Calculation
- Chapter 8 Programming
- Chapter 9 Spreadsheet
- Chapter 10 eActivity
- Chapter 11 Memory Manager
- Chapter 12 System Manager
- Chapter 13 Data Communication
- Chapter 14 Geometry
- Chapter 15 Picture Plot
- Chapter 16 3D Graph Function
- Appendix
- Examination Mode
- E-CON4 Application (English)
- 1. E-CON4 Mode Overview
- 2. Sampling Screen
- 3. Auto Sensor Detection (CLAB Only)
- 4. Selecting a Sensor
- 5. Configuring the Sampling Setup
- 6. Performing Auto Sensor Calibration and Zero Adjustment
- 7. Using a Custom Probe
- 8. Using Setup Memory
- 9. Starting a Sampling Operation
- 10. Using Sample Data Memory
- 11. Using the Graph Analysis Tools to Graph Data
- 12. Graph Analysis Tool Graph Screen Operations
- 13. Calling E-CON4 Functions from an eActivity
2-17
k Hyperbolic and Inverse Hyperbolic Functions
• Be sure to specify Comp for Mode in the Setup screen.
Example Operation
sinh 3.6 = 18.28545536
K6(g)2(HYPERBL)1(sinh) 3.6w
cosh
–1
20
15
= 0.7953654612
K6(g)2(HYPERBL)5(cosh
–1
)'20c15w
<Linear input/output mode>
K6(g)2(HYPERBL)5(cosh
–1
)(20
/15)w
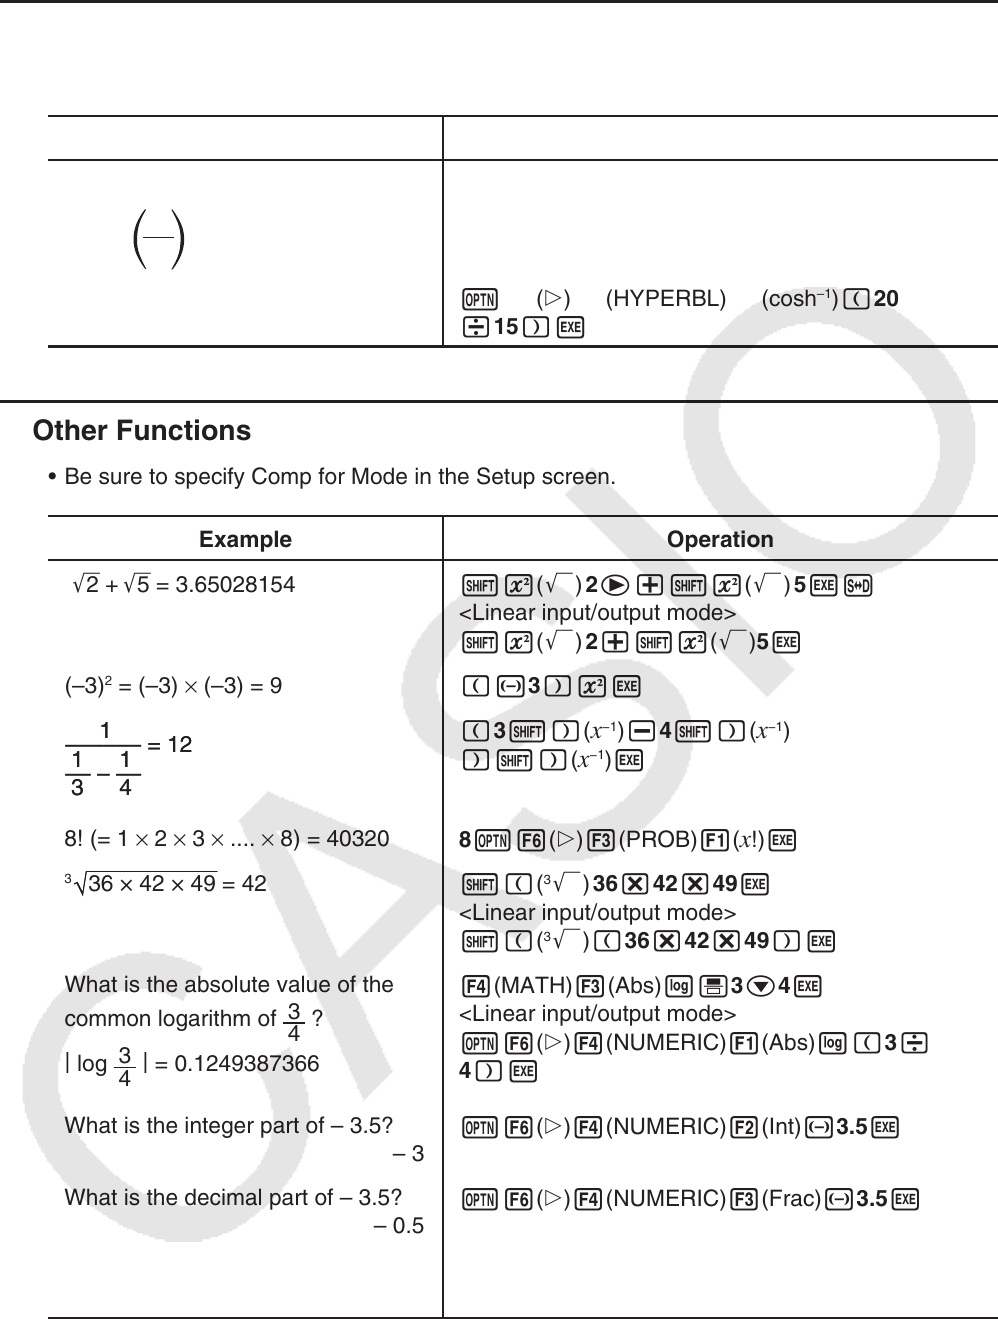
k Other Functions
• Be sure to specify Comp for Mode in the Setup screen.
Example Operation
'2 + '5 = 3.65028154
!x(') 2e+!x(') 5wf
<Linear input/output mode>
!x(') 2+!x(')5w
(–3)
2
= (–3) × (–3) = 9
(-3)xw
(3!)(x
−1
)-4!)(x
−1
)
)!)(
x
−1
)w
8! (= 1 × 2 × 3 × .... × 8) = 40320
8K6(g)3(PROB)1(
x!)w
3
36 × 42 × 49 = 42
!((
3
') 36*42*49w
<Linear input/output mode>
!((
3
')(36*42*49)w
What is the absolute value of the
common logarithm of
3
4
?
|
log
3
4
|
= 0.1249387366
4(MATH)3(Abs)l'3c4w
<Linear input/output mode>
K6(g)4(NUMERIC)1(Abs)l(3/
4)w
What is the integer part of – 3.5?
– 3
K6(g)4(NUMERIC)2(Int)-3.5w
What is the decimal part of – 3.5?
– 0.5
K6(g)4(NUMERIC)3(Frac)-3.5w
What is the nearest integer not
exceeding – 3.5? – 4
K6(g)4(NUMERIC)5(Intg)-3.5w
1
–––––– = 12
1 1
–– – ––
3 4
1
–––––– = 12
1 1
–– – ––
3 4