
User Manual
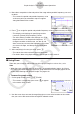
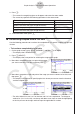
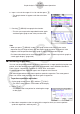
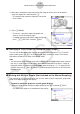
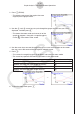
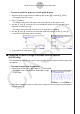
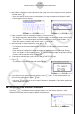
Table Of Contents
- Contents
- Getting Acquainted — Read This First!
- Chapter 1 Basic Operation
- Chapter 2 Manual Calculations
- 1. Basic Calculations
- 2. Special Functions
- 3. Specifying the Angle Unit and Display Format
- 4. Function Calculations
- 5. Numerical Calculations
- 6. Complex Number Calculations
- 7. Binary, Octal, Decimal, and Hexadecimal Calculations with Integers
- 8. Matrix Calculations
- 9. Vector Calculations
- 10. Metric Conversion Calculations
- Chapter 3 List Function
- Chapter 4 Equation Calculations
- Chapter 5 Graphing
- 1. Sample Graphs
- 2. Controlling What Appears on a Graph Screen
- 3. Drawing a Graph
- 4. Saving and Recalling Graph Screen Contents
- 5. Drawing Two Graphs on the Same Screen
- 6. Manual Graphing
- 7. Using Tables
- 8. Modifying a Graph
- 9. Dynamic Graphing
- 10. Graphing a Recursion Formula
- 11. Graphing a Conic Section
- 12. Drawing Dots, Lines, and Text on the Graph Screen (Sketch)
- 13. Function Analysis
- Chapter 6 Statistical Graphs and Calculations
- 1. Before Performing Statistical Calculations
- 2. Calculating and Graphing Single-Variable Statistical Data
- 3. Calculating and Graphing Paired-Variable Statistical Data (Curve Fitting)
- 4. Performing Statistical Calculations
- 5. Tests
- 6. Confidence Interval
- 7. Distribution
- 8. Input and Output Terms of Tests, Confidence Interval, and Distribution
- 9. Statistic Formula
- Chapter 7 Financial Calculation
- Chapter 8 Programming
- Chapter 9 Spreadsheet
- Chapter 10 eActivity
- Chapter 11 Memory Manager
- Chapter 12 System Manager
- Chapter 13 Data Communication
- Chapter 14 Geometry
- Chapter 15 Picture Plot
- Chapter 16 3D Graph Function
- Appendix
- Examination Mode
- E-CON4 Application (English)
- 1. E-CON4 Mode Overview
- 2. Sampling Screen
- 3. Auto Sensor Detection (CLAB Only)
- 4. Selecting a Sensor
- 5. Configuring the Sampling Setup
- 6. Performing Auto Sensor Calibration and Zero Adjustment
- 7. Using a Custom Probe
- 8. Using Setup Memory
- 9. Starting a Sampling Operation
- 10. Using Sample Data Memory
- 11. Using the Graph Analysis Tools to Graph Data
- 12. Graph Analysis Tool Graph Screen Operations
- 13. Calling E-CON4 Functions from an eActivity
ε-49
Graph Analysis Tool Graph Screen Operations
3. Move the trace pointer to the end point of the range you want to output from the speaker,
and then press w.
• After you specify the start point and end point, an output frequency dialog box shown
below appears on the display.
→
4. Input a percent value for the output frequency value you want.
• The output frequency specification is a percent value. To output the original sound as-is,
specify 100%. To raise the original sound by one octave, input a value of 200%. To
lower the original sound by one octave, input a value of 50%.
5. After inputting an output frequency value, press w.
• This outputs the waveform between the start point and end point from the EA-200
speaker.
• If the sound you configured cannot be output for some reason, the message “Range
Error” will appear. If this happens, press J to scroll back through the previous setting
screens and change the setup as required.
6. To terminate sound output, press the EA-200 [START/STOP] key.
7. Press w.
• This displays a screen like the one shown nearby.
8. If you want to retry output from the speaker, press 1(Yes). To exit the procedure and
return to the graph screen, press 6(No).
• Pressing 1(Yes) returns to the “Output Frequency” dialog box. From there, repeat the
above steps from step 4.
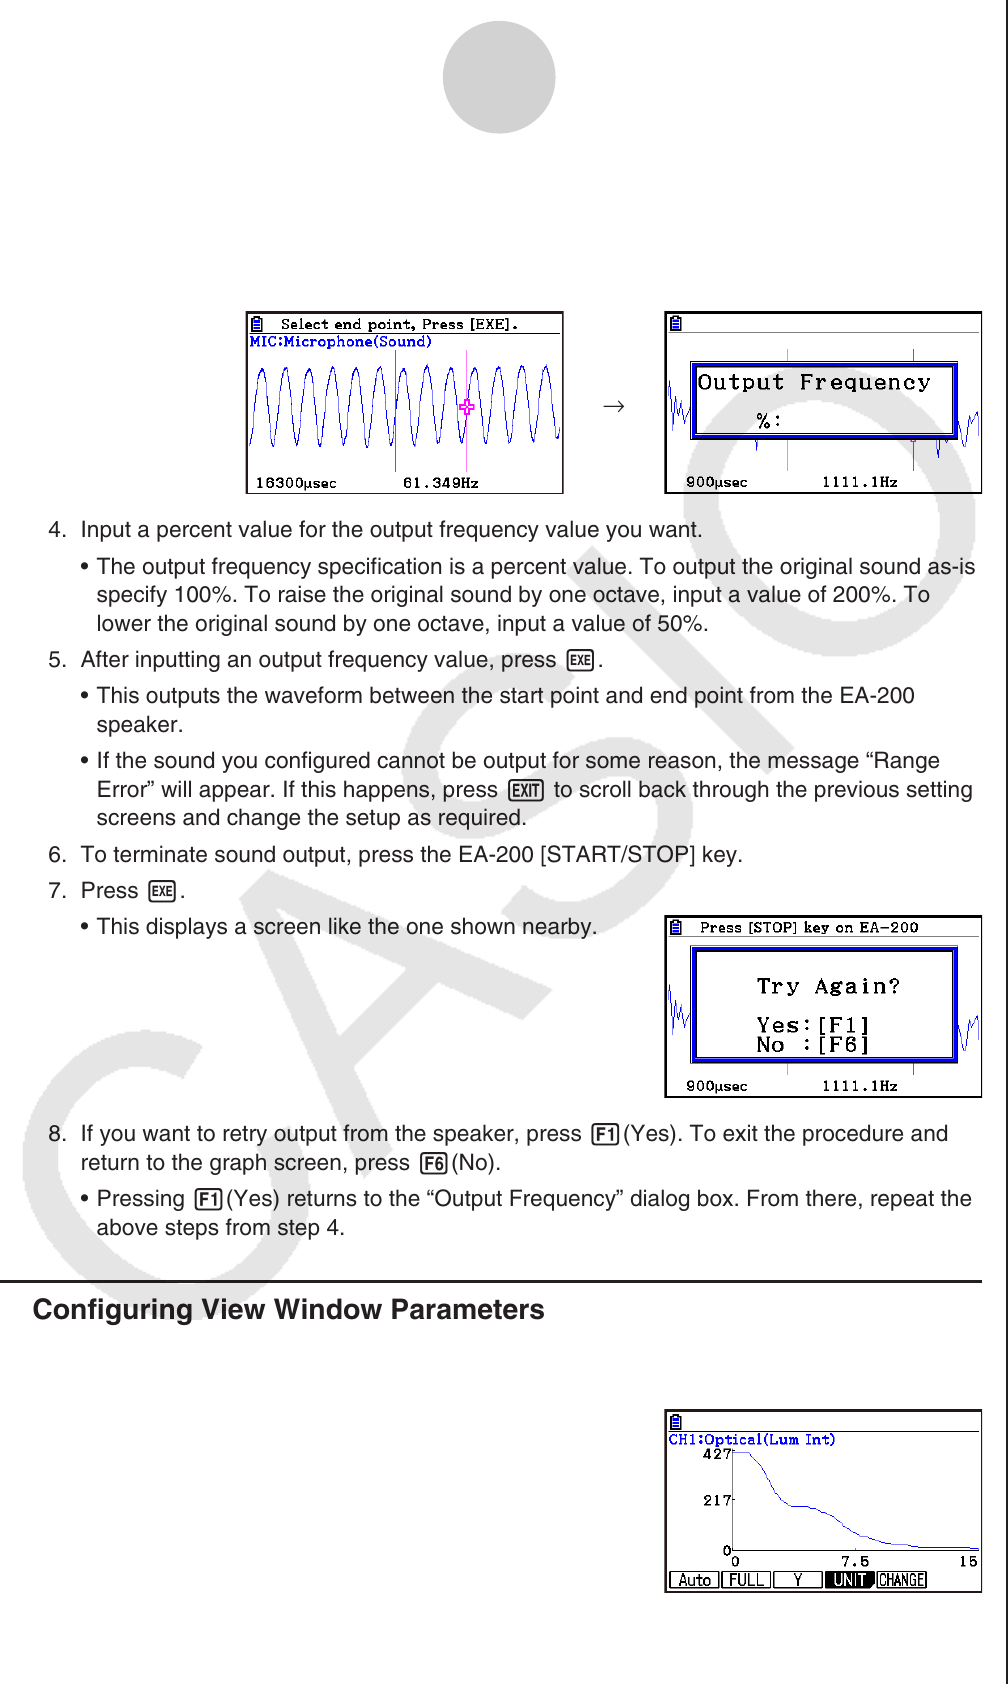
k Configuring View Window Parameters
Pressing !3(V-Window) while the graph screen is on the display displays a View
Window function key menu along the bottom of the display.