
User Manual
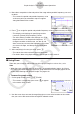
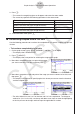
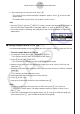
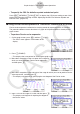
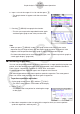
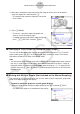
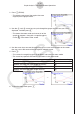
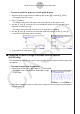
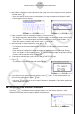
Table Of Contents
- Contents
- Getting Acquainted — Read This First!
- Chapter 1 Basic Operation
- Chapter 2 Manual Calculations
- 1. Basic Calculations
- 2. Special Functions
- 3. Specifying the Angle Unit and Display Format
- 4. Function Calculations
- 5. Numerical Calculations
- 6. Complex Number Calculations
- 7. Binary, Octal, Decimal, and Hexadecimal Calculations with Integers
- 8. Matrix Calculations
- 9. Vector Calculations
- 10. Metric Conversion Calculations
- Chapter 3 List Function
- Chapter 4 Equation Calculations
- Chapter 5 Graphing
- 1. Sample Graphs
- 2. Controlling What Appears on a Graph Screen
- 3. Drawing a Graph
- 4. Saving and Recalling Graph Screen Contents
- 5. Drawing Two Graphs on the Same Screen
- 6. Manual Graphing
- 7. Using Tables
- 8. Modifying a Graph
- 9. Dynamic Graphing
- 10. Graphing a Recursion Formula
- 11. Graphing a Conic Section
- 12. Drawing Dots, Lines, and Text on the Graph Screen (Sketch)
- 13. Function Analysis
- Chapter 6 Statistical Graphs and Calculations
- 1. Before Performing Statistical Calculations
- 2. Calculating and Graphing Single-Variable Statistical Data
- 3. Calculating and Graphing Paired-Variable Statistical Data (Curve Fitting)
- 4. Performing Statistical Calculations
- 5. Tests
- 6. Confidence Interval
- 7. Distribution
- 8. Input and Output Terms of Tests, Confidence Interval, and Distribution
- 9. Statistic Formula
- Chapter 7 Financial Calculation
- Chapter 8 Programming
- Chapter 9 Spreadsheet
- Chapter 10 eActivity
- Chapter 11 Memory Manager
- Chapter 12 System Manager
- Chapter 13 Data Communication
- Chapter 14 Geometry
- Chapter 15 Picture Plot
- Chapter 16 3D Graph Function
- Appendix
- Examination Mode
- E-CON4 Application (English)
- 1. E-CON4 Mode Overview
- 2. Sampling Screen
- 3. Auto Sensor Detection (CLAB Only)
- 4. Selecting a Sensor
- 5. Configuring the Sampling Setup
- 6. Performing Auto Sensor Calibration and Zero Adjustment
- 7. Using a Custom Probe
- 8. Using Setup Memory
- 9. Starting a Sampling Operation
- 10. Using Sample Data Memory
- 11. Using the Graph Analysis Tools to Graph Data
- 12. Graph Analysis Tool Graph Screen Operations
- 13. Calling E-CON4 Functions from an eActivity
ε-46
Graph Analysis Tool Graph Screen Operations
4. Move the trace pointer to the end point of the range for which you want to perform
quadratic regression, and then press w.
• This displays the quadratic regression calculation
result screen.
5. Press 6(DRAW).
• This draws a quadratic regression graph and
overlays it over the original graph.
• To delete the overlaid quadratic regression graph,
press !4(SKETCH) and then 1(Cls).
k Overlaying a Y=f(x) Graph on a Sampled Result Graph
You can use the E-CON4 mode to graph equations based on the form Y=f(x). From the
graph screen, press K5(Y=fx) to display the graph relation list screen. From there,
operations are identical to those in the Graph mode.
Note
• The data on the graph relation list screen is shared with the Graph mode. Note, however,
that only Y= type graphs can be used in the E-CON4 mode. Because of this, calling up
the graph relation list screen from the E-CON4 mode will display a “Y” (Y= type) item for
function menu key 3. Also, 5(MODIFY) is not displayed, because it is not used in the
E-CON4 mode.
k Working with Multiple Graphs (Not included on the Manual Sampling)
The procedures in this section explain how you can zoom or move a particular graph when
there are multiple graphs on the display.
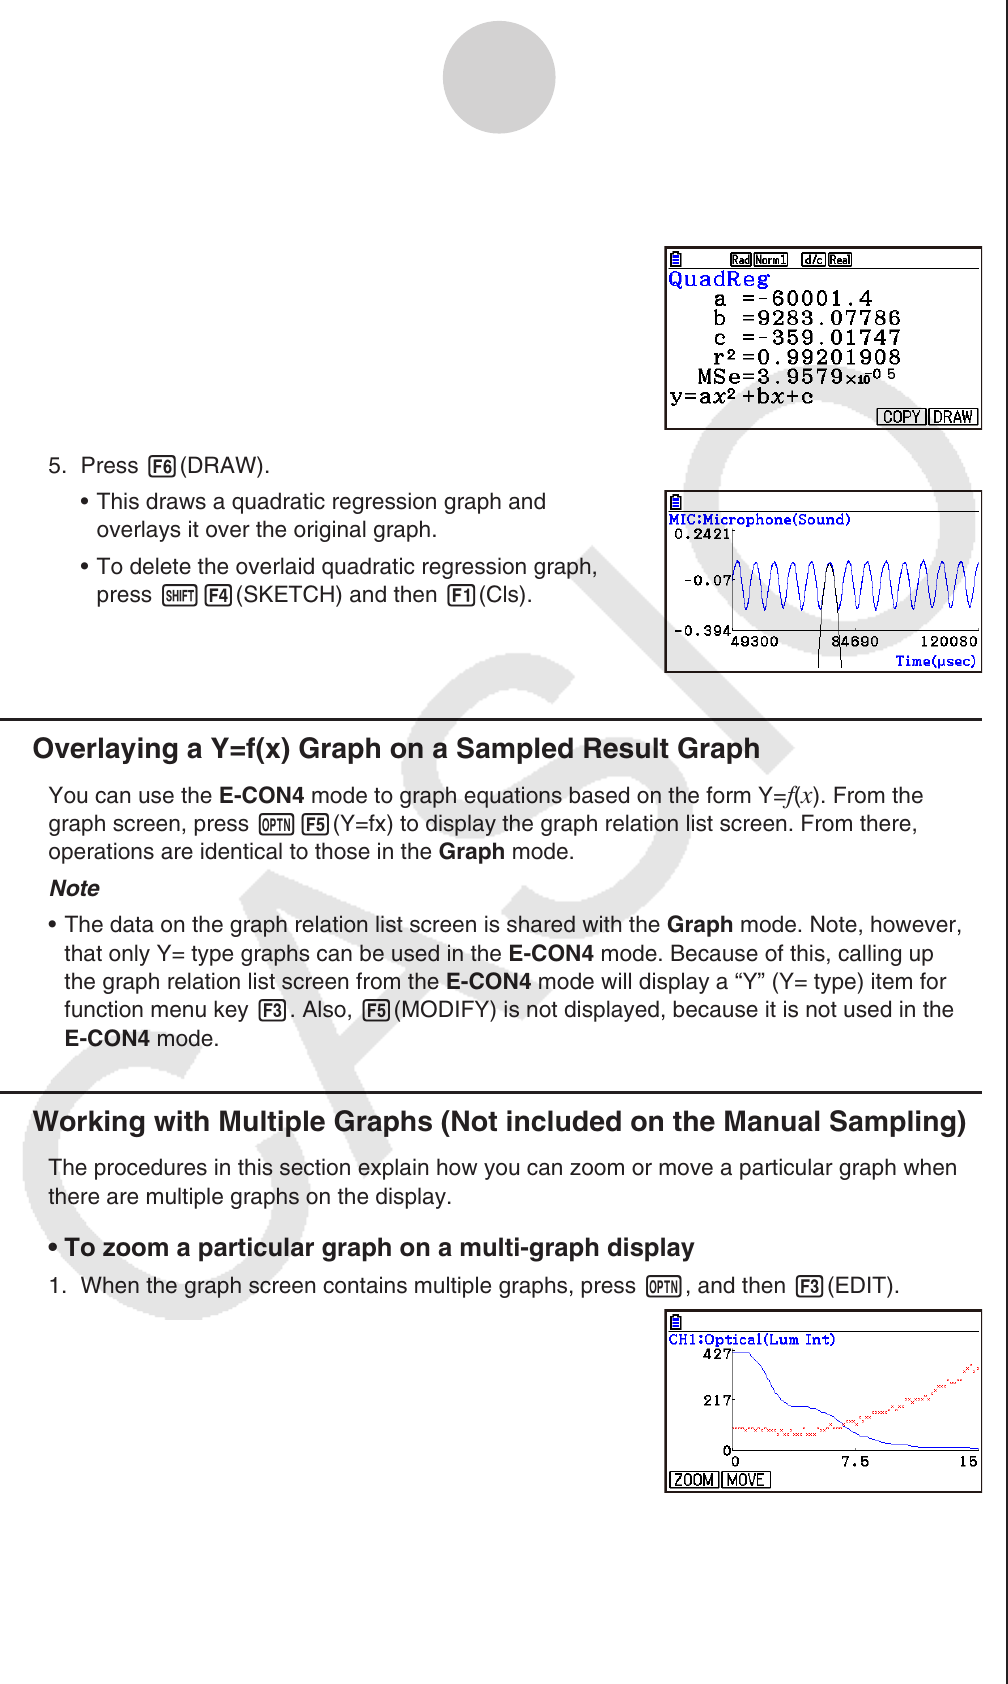
• To zoom a particular graph on a multi-graph display
1. When the graph screen contains multiple graphs, press K, and then 3(EDIT).
• The EDIT menu appears at the bottom of the display.