
User Manual
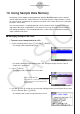
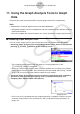
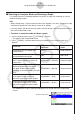
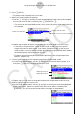
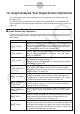
Table Of Contents
- Contents
- Getting Acquainted — Read This First!
- Chapter 1 Basic Operation
- Chapter 2 Manual Calculations
- 1. Basic Calculations
- 2. Special Functions
- 3. Specifying the Angle Unit and Display Format
- 4. Function Calculations
- 5. Numerical Calculations
- 6. Complex Number Calculations
- 7. Binary, Octal, Decimal, and Hexadecimal Calculations with Integers
- 8. Matrix Calculations
- 9. Vector Calculations
- 10. Metric Conversion Calculations
- Chapter 3 List Function
- Chapter 4 Equation Calculations
- Chapter 5 Graphing
- 1. Sample Graphs
- 2. Controlling What Appears on a Graph Screen
- 3. Drawing a Graph
- 4. Saving and Recalling Graph Screen Contents
- 5. Drawing Two Graphs on the Same Screen
- 6. Manual Graphing
- 7. Using Tables
- 8. Modifying a Graph
- 9. Dynamic Graphing
- 10. Graphing a Recursion Formula
- 11. Graphing a Conic Section
- 12. Drawing Dots, Lines, and Text on the Graph Screen (Sketch)
- 13. Function Analysis
- Chapter 6 Statistical Graphs and Calculations
- 1. Before Performing Statistical Calculations
- 2. Calculating and Graphing Single-Variable Statistical Data
- 3. Calculating and Graphing Paired-Variable Statistical Data (Curve Fitting)
- 4. Performing Statistical Calculations
- 5. Tests
- 6. Confidence Interval
- 7. Distribution
- 8. Input and Output Terms of Tests, Confidence Interval, and Distribution
- 9. Statistic Formula
- Chapter 7 Financial Calculation
- Chapter 8 Programming
- Chapter 9 Spreadsheet
- Chapter 10 eActivity
- Chapter 11 Memory Manager
- Chapter 12 System Manager
- Chapter 13 Data Communication
- Chapter 14 Geometry
- Chapter 15 Picture Plot
- Chapter 16 3D Graph Function
- Appendix
- Examination Mode
- E-CON4 Application (English)
- 1. E-CON4 Mode Overview
- 2. Sampling Screen
- 3. Auto Sensor Detection (CLAB Only)
- 4. Selecting a Sensor
- 5. Configuring the Sampling Setup
- 6. Performing Auto Sensor Calibration and Zero Adjustment
- 7. Using a Custom Probe
- 8. Using Setup Memory
- 9. Starting a Sampling Operation
- 10. Using Sample Data Memory
- 11. Using the Graph Analysis Tools to Graph Data
- 12. Graph Analysis Tool Graph Screen Operations
- 13. Calling E-CON4 Functions from an eActivity
ε-36
Using the Graph Analysis Tools to Graph Data
k Selecting an Analysis Mode and Drawing a Graph
This section contains a detailed procedure that covers all steps from selecting an analysis
mode to drawing a graph.
Note
• Step 4 through step 7 are not essential and may be skipped, if you want. Skipping any step
automatically applies the initial default values for its settings.
• If you skip step 2, the default analysis mode is the one whose name is displayed in the top
line of the Graph Mode screen.
• To select an analysis mode and draw a graph
1. On the sampling screen, press 4(OTHER)1(GRAPH).
• This displays the Graph Mode screen.
2. Press 3(MODE), and then select the analysis mode you want from the menu that
appears.
To do this:
Perform this menu
operation:
To select this
mode:
Graph three sets of sampled data
simultaneously
[Norm] Graph Analysis
Graph sampled data along with its first
and second derivative graph
[diff] d/dt & d
2
/dt
2
Display the graphs of different sampled
data in upper and lower windows for
comparison
[COMPARE] → [GRAPH]
Compare Graph
Output sampled data from the speaker,
displaying graph of the raw data in
the upper window and the output
waveform in the lower window (EA-200
only)
[COMPARE] → [Sound]
Compare Sound
Display the graph of sampled data
in the upper window and its first
derivative graph in the lower window
[COMPARE] → [d/dt]
Compare d/dt
Display the graph of sampled data
in the upper window and its second
derivative graph in the lower window
[COMPARE] → [d
2
/dt
2
]
Compare d
2
/dt
2
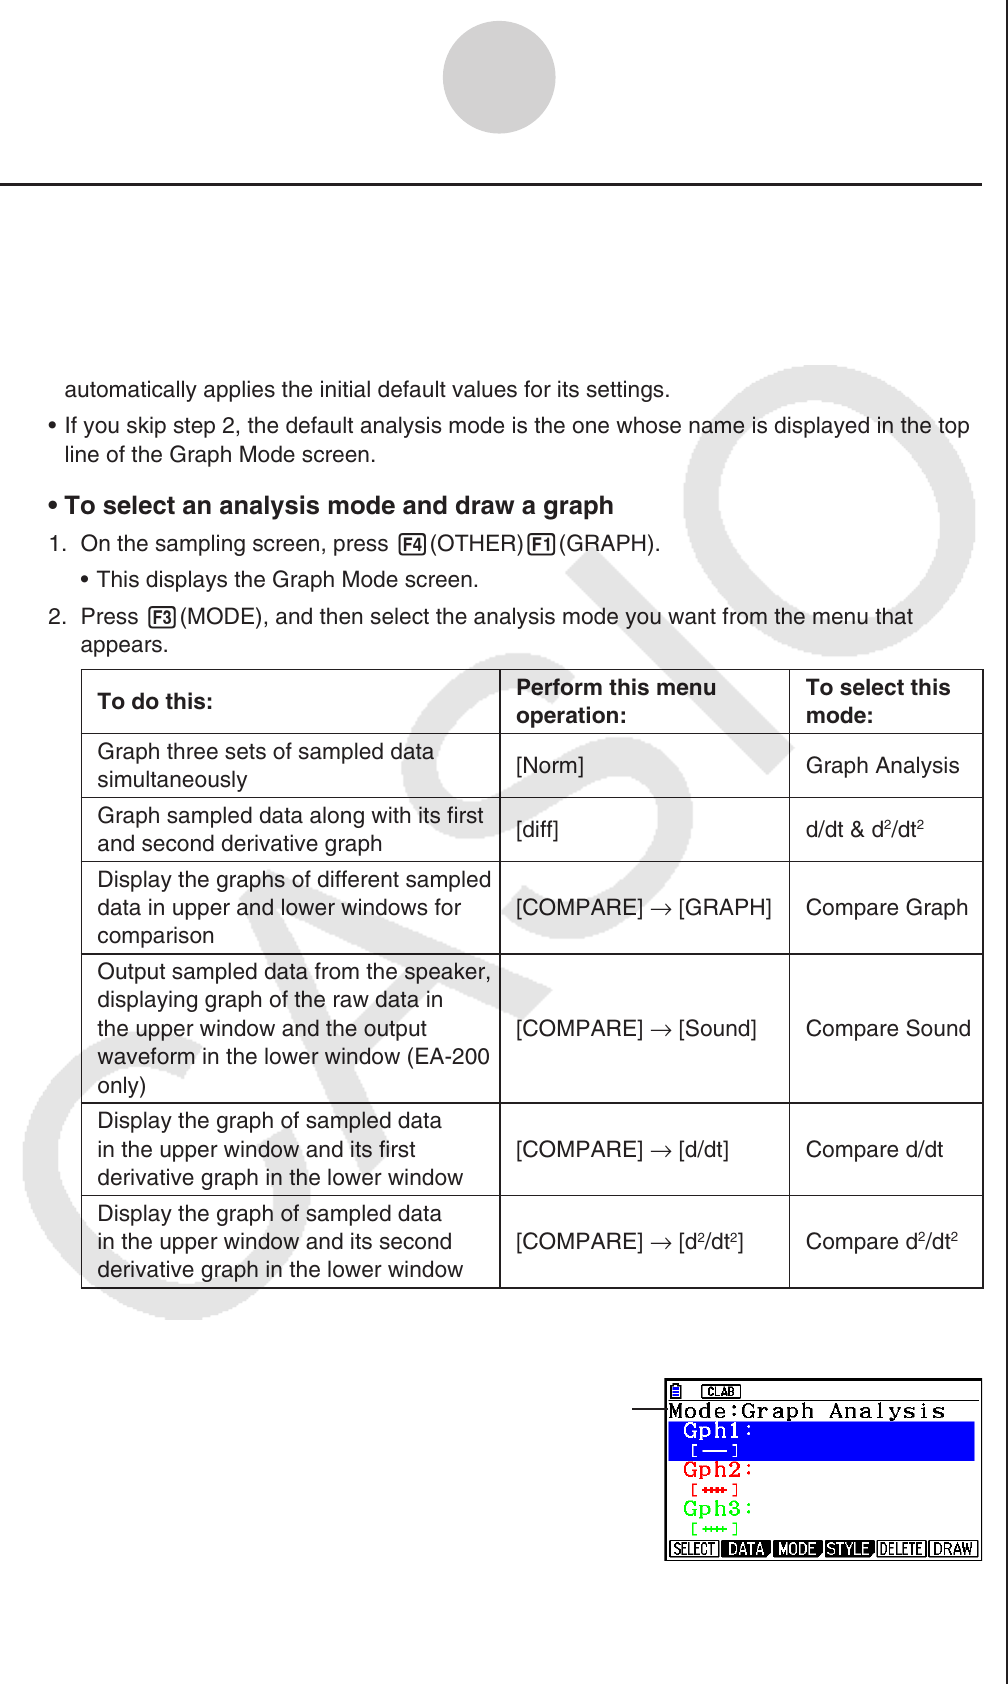
• The name of the currently selected mode appears in the top line of the Graph Mode
screen.
Analysis mode name