
User Manual
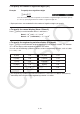
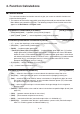

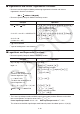
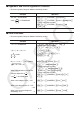
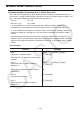


Table Of Contents
- Contents
- Getting Acquainted — Read This First!
- Chapter 1 Basic Operation
- Chapter 2 Manual Calculations
- 1. Basic Calculations
- 2. Special Functions
- 3. Specifying the Angle Unit and Display Format
- 4. Function Calculations
- 5. Numerical Calculations
- 6. Complex Number Calculations
- 7. Binary, Octal, Decimal, and Hexadecimal Calculations with Integers
- 8. Matrix Calculations
- 9. Vector Calculations
- 10. Metric Conversion Calculations
- Chapter 3 List Function
- Chapter 4 Equation Calculations
- Chapter 5 Graphing
- 1. Sample Graphs
- 2. Controlling What Appears on a Graph Screen
- 3. Drawing a Graph
- 4. Saving and Recalling Graph Screen Contents
- 5. Drawing Two Graphs on the Same Screen
- 6. Manual Graphing
- 7. Using Tables
- 8. Modifying a Graph
- 9. Dynamic Graphing
- 10. Graphing a Recursion Formula
- 11. Graphing a Conic Section
- 12. Drawing Dots, Lines, and Text on the Graph Screen (Sketch)
- 13. Function Analysis
- Chapter 6 Statistical Graphs and Calculations
- 1. Before Performing Statistical Calculations
- 2. Calculating and Graphing Single-Variable Statistical Data
- 3. Calculating and Graphing Paired-Variable Statistical Data (Curve Fitting)
- 4. Performing Statistical Calculations
- 5. Tests
- 6. Confidence Interval
- 7. Distribution
- 8. Input and Output Terms of Tests, Confidence Interval, and Distribution
- 9. Statistic Formula
- Chapter 7 Financial Calculation
- Chapter 8 Programming
- Chapter 9 Spreadsheet
- Chapter 10 eActivity
- Chapter 11 Memory Manager
- Chapter 12 System Manager
- Chapter 13 Data Communication
- Chapter 14 Geometry
- Chapter 15 Picture Plot
- Chapter 16 3D Graph Function
- Appendix
- Examination Mode
- E-CON4 Application (English)
- 1. E-CON4 Mode Overview
- 2. Sampling Screen
- 3. Auto Sensor Detection (CLAB Only)
- 4. Selecting a Sensor
- 5. Configuring the Sampling Setup
- 6. Performing Auto Sensor Calibration and Zero Adjustment
- 7. Using a Custom Probe
- 8. Using Setup Memory
- 9. Starting a Sampling Operation
- 10. Using Sample Data Memory
- 11. Using the Graph Analysis Tools to Graph Data
- 12. Graph Analysis Tool Graph Screen Operations
- 13. Calling E-CON4 Functions from an eActivity
2-13
u To specify the number of significant digits ( Sci)
Example To specify three significant digits
2(Sci) dw
Press the number key that corresponds to the number of significant digits you want to specify
(
n = 0 to 9). Specifying 0 makes the number of significant digits 10.
• Displayed values are rounded off to the number of significant digits you specify.
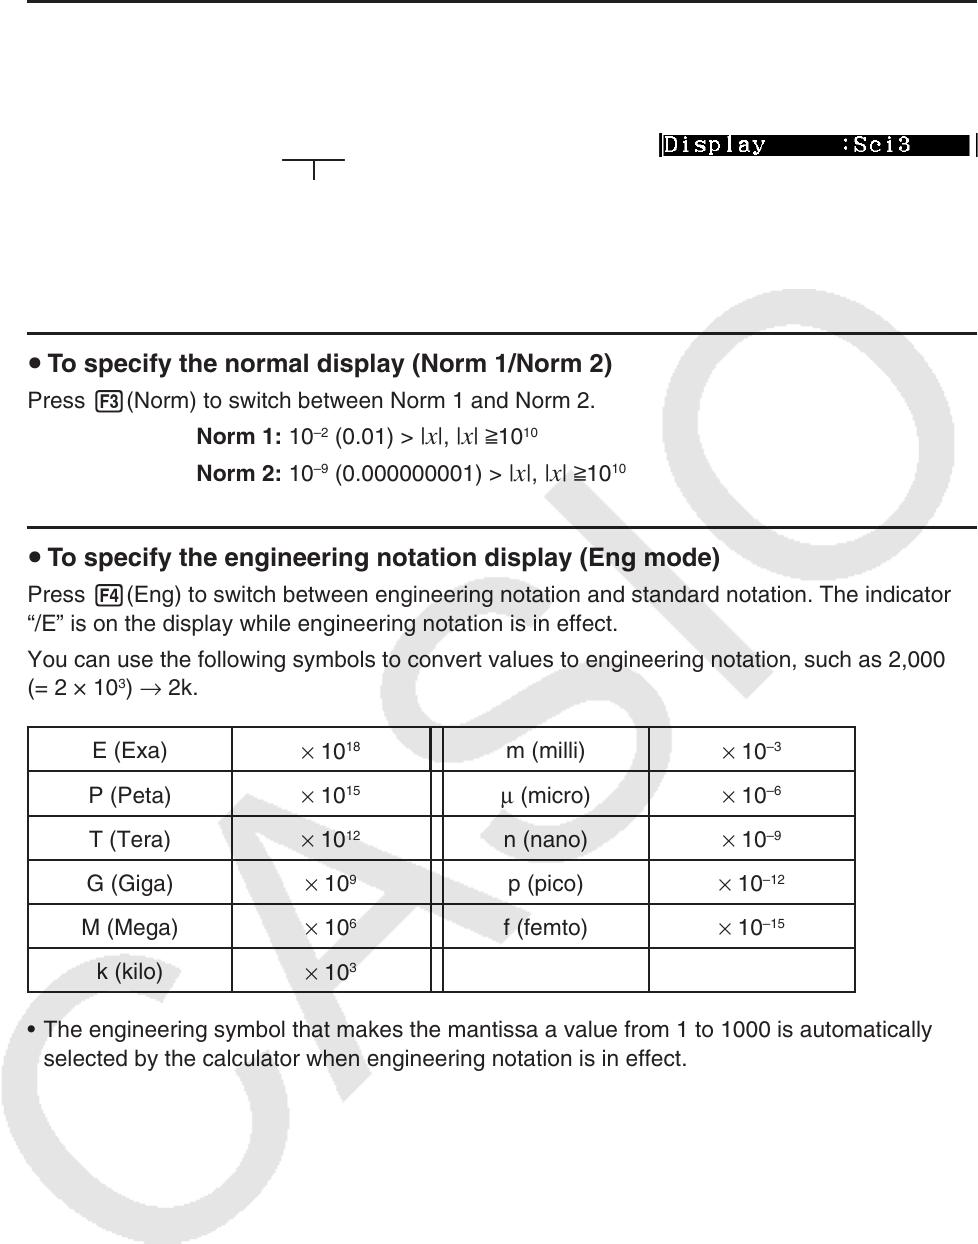
u To specify the normal display ( Norm 1/Norm 2)
Press 3(Norm) to switch between Norm 1 and Norm 2.
Norm 1: 10
–2
(0.01) > | x |, | x | >10
10
Norm 2: 10
–9
(0.000000001) > | x |, | x | >10
10
u To specify the engineering notation display ( Eng mode)
Press 4(Eng) to switch between engineering notation and standard notation. The indicator
“/E” is on the display while engineering notation is in effect.
You can use the following symbols to convert values to engineering notation, such as 2,000
(= 2 × 10
3
) → 2k.
E (Exa)
× 10
18
m (milli)
× 10
–3
P (Peta)
× 10
15
μ (micro) × 10
–6
T (Tera)
× 10
12
n (nano)
× 10
–9
G (Giga)
× 10
9
p (pico)
× 10
–12
M (Mega)
× 10
6
f (femto)
× 10
–15
k (kilo)
× 10
3
• The engineering symbol that makes the mantissa a value from 1 to 1000 is automatically
selected by the calculator when engineering notation is in effect.