
User Manual
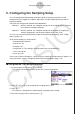
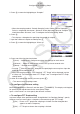
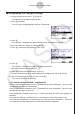
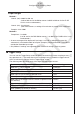
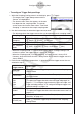
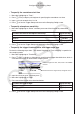
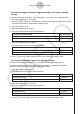
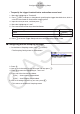
Table Of Contents
- Contents
- Getting Acquainted — Read This First!
- Chapter 1 Basic Operation
- Chapter 2 Manual Calculations
- 1. Basic Calculations
- 2. Special Functions
- 3. Specifying the Angle Unit and Display Format
- 4. Function Calculations
- 5. Numerical Calculations
- 6. Complex Number Calculations
- 7. Binary, Octal, Decimal, and Hexadecimal Calculations with Integers
- 8. Matrix Calculations
- 9. Vector Calculations
- 10. Metric Conversion Calculations
- Chapter 3 List Function
- Chapter 4 Equation Calculations
- Chapter 5 Graphing
- 1. Sample Graphs
- 2. Controlling What Appears on a Graph Screen
- 3. Drawing a Graph
- 4. Saving and Recalling Graph Screen Contents
- 5. Drawing Two Graphs on the Same Screen
- 6. Manual Graphing
- 7. Using Tables
- 8. Modifying a Graph
- 9. Dynamic Graphing
- 10. Graphing a Recursion Formula
- 11. Graphing a Conic Section
- 12. Drawing Dots, Lines, and Text on the Graph Screen (Sketch)
- 13. Function Analysis
- Chapter 6 Statistical Graphs and Calculations
- 1. Before Performing Statistical Calculations
- 2. Calculating and Graphing Single-Variable Statistical Data
- 3. Calculating and Graphing Paired-Variable Statistical Data (Curve Fitting)
- 4. Performing Statistical Calculations
- 5. Tests
- 6. Confidence Interval
- 7. Distribution
- 8. Input and Output Terms of Tests, Confidence Interval, and Distribution
- 9. Statistic Formula
- Chapter 7 Financial Calculation
- Chapter 8 Programming
- Chapter 9 Spreadsheet
- Chapter 10 eActivity
- Chapter 11 Memory Manager
- Chapter 12 System Manager
- Chapter 13 Data Communication
- Chapter 14 Geometry
- Chapter 15 Picture Plot
- Chapter 16 3D Graph Function
- Appendix
- Examination Mode
- E-CON4 Application (English)
- 1. E-CON4 Mode Overview
- 2. Sampling Screen
- 3. Auto Sensor Detection (CLAB Only)
- 4. Selecting a Sensor
- 5. Configuring the Sampling Setup
- 6. Performing Auto Sensor Calibration and Zero Adjustment
- 7. Using a Custom Probe
- 8. Using Setup Memory
- 9. Starting a Sampling Operation
- 10. Using Sample Data Memory
- 11. Using the Graph Analysis Tools to Graph Data
- 12. Graph Analysis Tool Graph Screen Operations
- 13. Calling E-CON4 Functions from an eActivity
ε-13
Configuring the Sampling Setup
5. Press c to move the highlighting to “Samples”.
When the sampling mode is “Periodic Sampling” and a CMA or Vernier Photogate
Pulley is assigned to the channel, “Distance” will be displayed in place of “Samples”. For
information about “Distance”, see “To configure the Distance setting” below.
6. Press e.
This displays a dialog box for specifying the number of samples.
7. Input the number of samples and then press w.
8. Press c to move the highlighting to “Warm-up”.
9. Press one of the functions keys below.
1(Auto) … Automatically configures warm-up time settings for each sensor.
2(Manual) … Select for manual input of the warm-up time in seconds units.
3(None) … Disables warm-up time.
Pressing 2(Manual) displays a dialog box for specifying the warm-up time. Input the
warm-up time and then press w.
When the sampling mode is “Fast Sampling”, “FFT Graph” will be displayed in place
of “Warm-up”. For information about “FFT Graph”, see “To configure the FFT Graph
setting” below.
10. After all of settings are the way you want, press J.
This returns to the sampling screen.
To configure the Distance setting
Move the highlighting to “Distance” and then press 1(NUMBER). This displays a dialog box
for specifying the drop distance for the smart pulley weight.
Input a value from 0.1 to 4.0 to specify the distance in meters.
To configure FFT Graph setting
In place of step 9 of the procedure under “Using Method 1 to Configure Settings”, specify
whether or not you want to draw a frequency characteristics graph (FFT Graph).
1(On) ... Draws an FFT graph after sampling is finished. Use the dialog box that
appears to select a frequency.
2(Off) ... FFT Graph no drawn after sampling is finished.
•
•
•
•
•
u
u