
User Manual

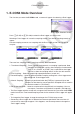
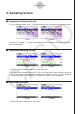
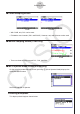
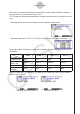
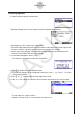
Table Of Contents
- Contents
- Getting Acquainted — Read This First!
- Chapter 1 Basic Operation
- Chapter 2 Manual Calculations
- 1. Basic Calculations
- 2. Special Functions
- 3. Specifying the Angle Unit and Display Format
- 4. Function Calculations
- 5. Numerical Calculations
- 6. Complex Number Calculations
- 7. Binary, Octal, Decimal, and Hexadecimal Calculations with Integers
- 8. Matrix Calculations
- 9. Vector Calculations
- 10. Metric Conversion Calculations
- Chapter 3 List Function
- Chapter 4 Equation Calculations
- Chapter 5 Graphing
- 1. Sample Graphs
- 2. Controlling What Appears on a Graph Screen
- 3. Drawing a Graph
- 4. Saving and Recalling Graph Screen Contents
- 5. Drawing Two Graphs on the Same Screen
- 6. Manual Graphing
- 7. Using Tables
- 8. Modifying a Graph
- 9. Dynamic Graphing
- 10. Graphing a Recursion Formula
- 11. Graphing a Conic Section
- 12. Drawing Dots, Lines, and Text on the Graph Screen (Sketch)
- 13. Function Analysis
- Chapter 6 Statistical Graphs and Calculations
- 1. Before Performing Statistical Calculations
- 2. Calculating and Graphing Single-Variable Statistical Data
- 3. Calculating and Graphing Paired-Variable Statistical Data (Curve Fitting)
- 4. Performing Statistical Calculations
- 5. Tests
- 6. Confidence Interval
- 7. Distribution
- 8. Input and Output Terms of Tests, Confidence Interval, and Distribution
- 9. Statistic Formula
- Chapter 7 Financial Calculation
- Chapter 8 Programming
- Chapter 9 Spreadsheet
- Chapter 10 eActivity
- Chapter 11 Memory Manager
- Chapter 12 System Manager
- Chapter 13 Data Communication
- Chapter 14 Geometry
- Chapter 15 Picture Plot
- Chapter 16 3D Graph Function
- Appendix
- Examination Mode
- E-CON4 Application (English)
- 1. E-CON4 Mode Overview
- 2. Sampling Screen
- 3. Auto Sensor Detection (CLAB Only)
- 4. Selecting a Sensor
- 5. Configuring the Sampling Setup
- 6. Performing Auto Sensor Calibration and Zero Adjustment
- 7. Using a Custom Probe
- 8. Using Setup Memory
- 9. Starting a Sampling Operation
- 10. Using Sample Data Memory
- 11. Using the Graph Analysis Tools to Graph Data
- 12. Graph Analysis Tool Graph Screen Operations
- 13. Calling E-CON4 Functions from an eActivity
ε-8
Sampling Screen
13. Depending on what you want to do, perform one of the operations below.
To change the output frequency and try again:
Press 1(Yes) to return to the Output Frequency dialog box. Next, perform the operation
starting from step 9, above.
To change the output range of the waveform graph and try again:
Press 6(No) to return to the graph screen in step 6, above. Next, perform the operation
starting from step 7, above.
To change the function:
Press 6(No)J to return to the function registration screen in step 5, above. Next,
perform the operation starting from step 5, above.
To exit the procedure and return to the sampling mode selection screen:
Press 6(No). Next, press J twice.
Sampling Screen Function Menu
1(SENSOR) …… Selects the sensor assigned to a channel.
2(CONFIG) …… Select to configure settings that control sampling (sampling period,
number of samples, warm-up time, etc.)
3(CALIB) …… Performs auto sensor calibration.
4(OTHER) …… Displays the submenu below.
1(GRAPH) …… Graphs the samples measured by the Data Logger. You can
use various graph analysis tools. (Cannot be used on the Period
Sampling screen.)
2(MEMORY) …… Saves Data Logger setup data.
5(INITIAL) …… Initializes setting parameters.
6(ABOUT) …… Shows version information about the Data Logger currently
connected to calculator.
5(MODE) …… Selects a sampling mode.
6(START) …… Starts sampling with the Data Logger.
k
•
•
•
•
•
•
•
•
•
•