
User Manual
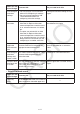
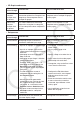
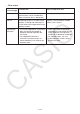
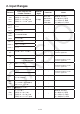
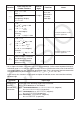
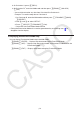

Table Of Contents
- Contents
- Getting Acquainted — Read This First!
- Chapter 1 Basic Operation
- Chapter 2 Manual Calculations
- 1. Basic Calculations
- 2. Special Functions
- 3. Specifying the Angle Unit and Display Format
- 4. Function Calculations
- 5. Numerical Calculations
- 6. Complex Number Calculations
- 7. Binary, Octal, Decimal, and Hexadecimal Calculations with Integers
- 8. Matrix Calculations
- 9. Vector Calculations
- 10. Metric Conversion Calculations
- Chapter 3 List Function
- Chapter 4 Equation Calculations
- Chapter 5 Graphing
- 1. Sample Graphs
- 2. Controlling What Appears on a Graph Screen
- 3. Drawing a Graph
- 4. Saving and Recalling Graph Screen Contents
- 5. Drawing Two Graphs on the Same Screen
- 6. Manual Graphing
- 7. Using Tables
- 8. Modifying a Graph
- 9. Dynamic Graphing
- 10. Graphing a Recursion Formula
- 11. Graphing a Conic Section
- 12. Drawing Dots, Lines, and Text on the Graph Screen (Sketch)
- 13. Function Analysis
- Chapter 6 Statistical Graphs and Calculations
- 1. Before Performing Statistical Calculations
- 2. Calculating and Graphing Single-Variable Statistical Data
- 3. Calculating and Graphing Paired-Variable Statistical Data (Curve Fitting)
- 4. Performing Statistical Calculations
- 5. Tests
- 6. Confidence Interval
- 7. Distribution
- 8. Input and Output Terms of Tests, Confidence Interval, and Distribution
- 9. Statistic Formula
- Chapter 7 Financial Calculation
- Chapter 8 Programming
- Chapter 9 Spreadsheet
- Chapter 10 eActivity
- Chapter 11 Memory Manager
- Chapter 12 System Manager
- Chapter 13 Data Communication
- Chapter 14 Geometry
- Chapter 15 Picture Plot
- Chapter 16 3D Graph Function
- Appendix
- Examination Mode
- E-CON4 Application (English)
- 1. E-CON4 Mode Overview
- 2. Sampling Screen
- 3. Auto Sensor Detection (CLAB Only)
- 4. Selecting a Sensor
- 5. Configuring the Sampling Setup
- 6. Performing Auto Sensor Calibration and Zero Adjustment
- 7. Using a Custom Probe
- 8. Using Setup Memory
- 9. Starting a Sampling Operation
- 10. Using Sample Data Memory
- 11. Using the Graph Analysis Tools to Graph Data
- 12. Graph Analysis Tool Graph Screen Operations
- 13. Calling E-CON4 Functions from an eActivity
α-14
2. Input Ranges
Function
Input range for real
number solutions
Internal
digits
Precision Notes
sin
x
cos x
tan x
(DEG) | x | < 9 × (10
9
)°
(RAD) |
x | < 5 × 10
7
π rad
(GRA) | x | < 1 × 10
10
grad
15 digits
As a rule,
precision is
± 1 at the
10th digit.*
However, for tan
x :
|
x | ≠ 90(2 n +1): DEG
|
x | ≠ π /2(2 n +1): RAD
|
x | ≠ 100(2 n +1): GRA
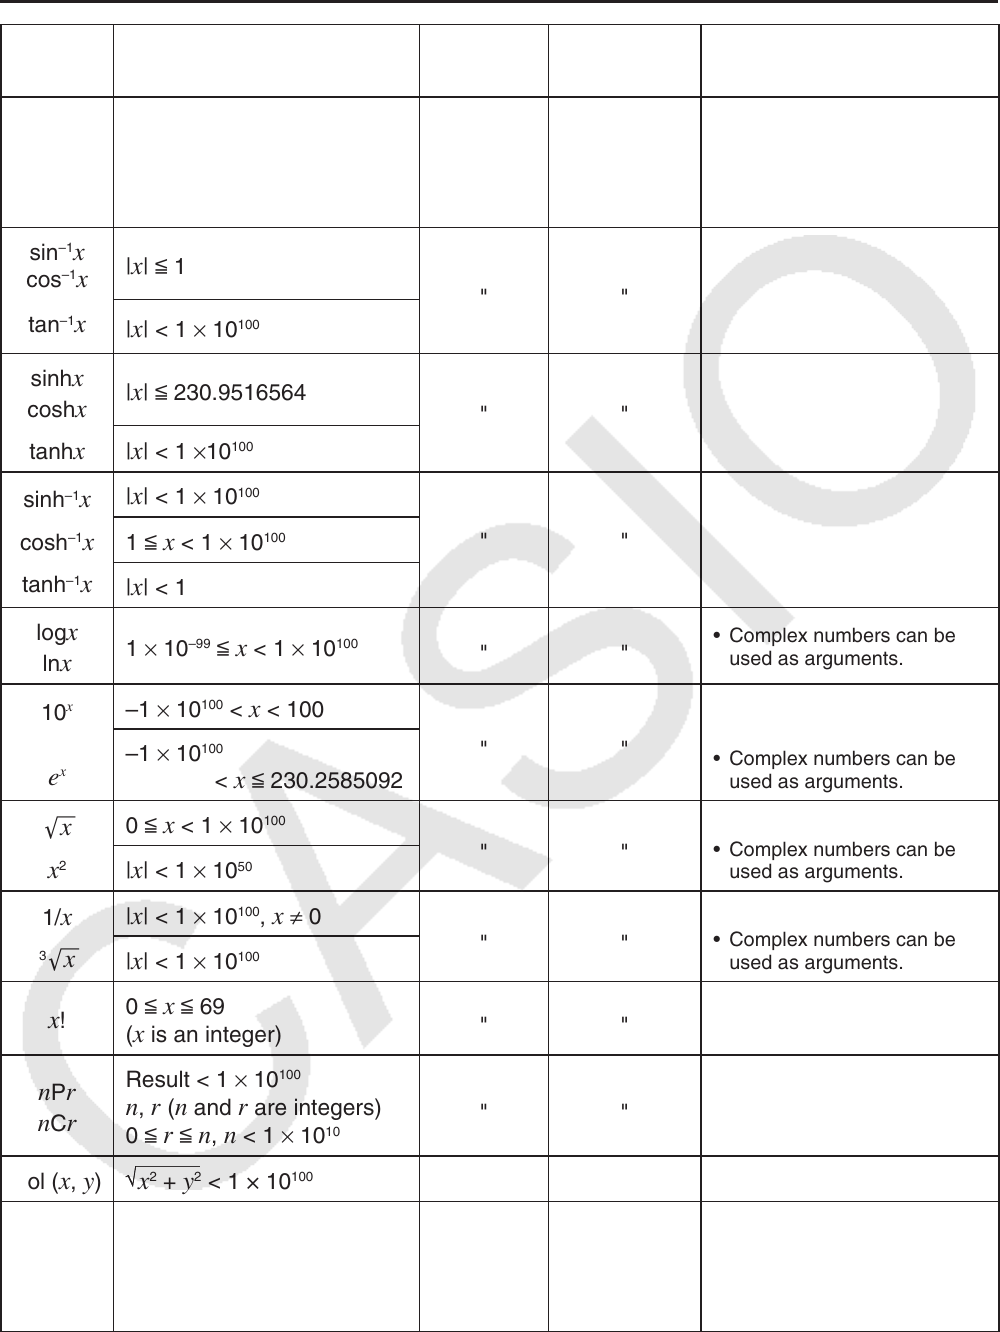
sin
–1
x
cos
–1
x
tan
–1
x
| x | < 1
" "
|
x | < 1 × 10
100
sinh x
cosh x
tanh x
| x | < 230.9516564
" "
|
x | < 1 × 10
100
sinh
–1
x
cosh
–1
x
tanh
–1
x
| x | < 1 × 10
100
" "
1 <
x < 1 × 10
100
| x | < 1
log
x
ln x
1 × 10
–99
< x < 1 × 10
100
" "
• Complex numbers can be
used as arguments.
10
x
e
x
–1 × 10
100
< x < 100
" "
• Complex numbers can be
used as arguments.
–1 × 10
100
< x < 230.2585092
'
x
x
2
0 < x < 1 × 10
100
" "
• Complex numbers can be
used as arguments.
| x | < 1 × 10
50
1/ x
3
'
x
| x | < 1 × 10
100
, x ≠ 0
" "
• Complex numbers can be
used as arguments.
| x | < 1 × 10
100
x !
0 < x < 69
( x is an integer)
" "
n P r
n
C r
Result < 1 × 10
100
n , r ( n and r are integers)
0 < r < n , n < 1 × 10
10
" "
Pol (
x , y ) x
2
+ y
2
< 1 × 10
100
" "
Rec
(
r ,
θ
)
|
r | < 1 × 10
100
(DEG) |
θ
| < 9 × (10
9
)°
(RAD) |
θ
| < 5 × 10
7
π rad
(GRA) |
θ
| < 1 × 10
10
grad
" "
However, for tan
θ
:
|
θ
| ≠ 90(2 n +1): DEG
|
θ
| ≠ π /2(2 n +1): RAD
|
θ
| ≠ 100(2 n +1): GRA