
User Manual
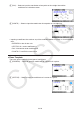
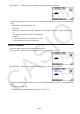
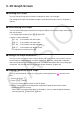
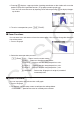
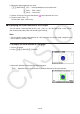
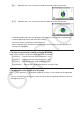
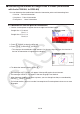
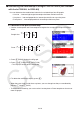
Table Of Contents
- Contents
- Getting Acquainted — Read This First!
- Chapter 1 Basic Operation
- Chapter 2 Manual Calculations
- 1. Basic Calculations
- 2. Special Functions
- 3. Specifying the Angle Unit and Display Format
- 4. Function Calculations
- 5. Numerical Calculations
- 6. Complex Number Calculations
- 7. Binary, Octal, Decimal, and Hexadecimal Calculations with Integers
- 8. Matrix Calculations
- 9. Vector Calculations
- 10. Metric Conversion Calculations
- Chapter 3 List Function
- Chapter 4 Equation Calculations
- Chapter 5 Graphing
- 1. Sample Graphs
- 2. Controlling What Appears on a Graph Screen
- 3. Drawing a Graph
- 4. Saving and Recalling Graph Screen Contents
- 5. Drawing Two Graphs on the Same Screen
- 6. Manual Graphing
- 7. Using Tables
- 8. Modifying a Graph
- 9. Dynamic Graphing
- 10. Graphing a Recursion Formula
- 11. Graphing a Conic Section
- 12. Drawing Dots, Lines, and Text on the Graph Screen (Sketch)
- 13. Function Analysis
- Chapter 6 Statistical Graphs and Calculations
- 1. Before Performing Statistical Calculations
- 2. Calculating and Graphing Single-Variable Statistical Data
- 3. Calculating and Graphing Paired-Variable Statistical Data (Curve Fitting)
- 4. Performing Statistical Calculations
- 5. Tests
- 6. Confidence Interval
- 7. Distribution
- 8. Input and Output Terms of Tests, Confidence Interval, and Distribution
- 9. Statistic Formula
- Chapter 7 Financial Calculation
- Chapter 8 Programming
- Chapter 9 Spreadsheet
- Chapter 10 eActivity
- Chapter 11 Memory Manager
- Chapter 12 System Manager
- Chapter 13 Data Communication
- Chapter 14 Geometry
- Chapter 15 Picture Plot
- Chapter 16 3D Graph Function
- Appendix
- Examination Mode
- E-CON4 Application (English)
- 1. E-CON4 Mode Overview
- 2. Sampling Screen
- 3. Auto Sensor Detection (CLAB Only)
- 4. Selecting a Sensor
- 5. Configuring the Sampling Setup
- 6. Performing Auto Sensor Calibration and Zero Adjustment
- 7. Using a Custom Probe
- 8. Using Setup Memory
- 9. Starting a Sampling Operation
- 10. Using Sample Data Memory
- 11. Using the Graph Analysis Tools to Graph Data
- 12. Graph Analysis Tool Graph Screen Operations
- 13. Calling E-CON4 Functions from an eActivity
16-14
5. 3D Graph Screen
Rotating a 3D Graph
You can use the cursor keys to rotate a 3D graph up, down, left, and right.
The settings on the 3D View Window change in accordance with how much its 3D graph is
rotated.
Auto Rotating a 3D Graph
You can rotate a 3D graph automatically using Auto Rotate. Auto rotation stops automatically
after two rotations.
1. On the 3D graph screen, press K2(ROTATE).
2. Select a rotation direction.
1(L→R) … Auto rotation from left to right.
2(R→L) … Auto rotation from right to left.
3(T→B) … Auto rotation from top to bottom.
4(B→T) … Auto rotation from bottom to top.
To stop the auto rotation, press A.
Saving a 3D Graph Screenshot
You can save a screenshot of the currently display 3D graph screen. You can then use the
saved image as the background in another application. Note that a 3D graph screenshot
does not include 3D View Window information. For information about how to save 3D graph
screenshot, see “Saving and Recalling Graph Screen Contents” (page 5-20).
Reading Coordinates on a Graph
You can read coordinate values on a 3D graph by moving the pointer ( ) with the cursor
keys.
1. Draw a 3D graph.
2. Press !1(TRACE).
This causes the pointer to flash on the 3D graph.
3. Use the cursor keys to move the pointer along the 3D graph to the location whose
coordinates you want to read.
When there are multiple 3D graphs on the display, you can move the pointer between
them by pressing 1(Next) and 2(Back).
k
k
•
k
k
•
•