
User Manual
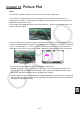
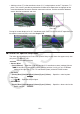
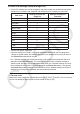
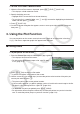
Table Of Contents
- Contents
- Getting Acquainted — Read This First!
- Chapter 1 Basic Operation
- Chapter 2 Manual Calculations
- 1. Basic Calculations
- 2. Special Functions
- 3. Specifying the Angle Unit and Display Format
- 4. Function Calculations
- 5. Numerical Calculations
- 6. Complex Number Calculations
- 7. Binary, Octal, Decimal, and Hexadecimal Calculations with Integers
- 8. Matrix Calculations
- 9. Vector Calculations
- 10. Metric Conversion Calculations
- Chapter 3 List Function
- Chapter 4 Equation Calculations
- Chapter 5 Graphing
- 1. Sample Graphs
- 2. Controlling What Appears on a Graph Screen
- 3. Drawing a Graph
- 4. Saving and Recalling Graph Screen Contents
- 5. Drawing Two Graphs on the Same Screen
- 6. Manual Graphing
- 7. Using Tables
- 8. Modifying a Graph
- 9. Dynamic Graphing
- 10. Graphing a Recursion Formula
- 11. Graphing a Conic Section
- 12. Drawing Dots, Lines, and Text on the Graph Screen (Sketch)
- 13. Function Analysis
- Chapter 6 Statistical Graphs and Calculations
- 1. Before Performing Statistical Calculations
- 2. Calculating and Graphing Single-Variable Statistical Data
- 3. Calculating and Graphing Paired-Variable Statistical Data (Curve Fitting)
- 4. Performing Statistical Calculations
- 5. Tests
- 6. Confidence Interval
- 7. Distribution
- 8. Input and Output Terms of Tests, Confidence Interval, and Distribution
- 9. Statistic Formula
- Chapter 7 Financial Calculation
- Chapter 8 Programming
- Chapter 9 Spreadsheet
- Chapter 10 eActivity
- Chapter 11 Memory Manager
- Chapter 12 System Manager
- Chapter 13 Data Communication
- Chapter 14 Geometry
- Chapter 15 Picture Plot
- Chapter 16 3D Graph Function
- Appendix
- Examination Mode
- E-CON4 Application (English)
- 1. E-CON4 Mode Overview
- 2. Sampling Screen
- 3. Auto Sensor Detection (CLAB Only)
- 4. Selecting a Sensor
- 5. Configuring the Sampling Setup
- 6. Performing Auto Sensor Calibration and Zero Adjustment
- 7. Using a Custom Probe
- 8. Using Setup Memory
- 9. Starting a Sampling Operation
- 10. Using Sample Data Memory
- 11. Using the Graph Analysis Tools to Graph Data
- 12. Graph Analysis Tool Graph Screen Operations
- 13. Calling E-CON4 Functions from an eActivity
15-4
k Plot List Function Menu
• {AXTRNS} ... Same as {AXTRNS} under “Picture Plot Screen Function Menu”.
• {EDIT} ... Selects to edit the currently highlighted value on the plot list.
• {DEL
•
BTM} ... Deletes the last line of data on the plot list.
• {DEL-ALL} ... Deletes all of the data on the plot list.
• {SET} ... Selects to configure the time (T) value (page 15-15).
• {JUMP} ... Displays the following submenu.
• {TOP}/{BOTTOM} ... {jump to the top line}/{jump to the bottom line}
• {Plot} ... Exits the plot list screen and enters the plot mode.
• {REG} ... Same as {REG} under “Picture Plot Screen Function Menu”.
• {STORE} ... Saves the specified Plot List column (X or Y) to list memory.
• {RECALL} ... Recalls list memory data to the Plot List X-column or Y-column.
k Plot Mode Function Menu
• {PICTURE} ... Same as {PICTURE} under “Picture Plot Screen Function Menu”.
• {UNDO} ... Deletes the last point plotted. Executing {UNDO} again will plot the deleted point.
• {EDIT} ... Same as {EDIT} under “Picture Plot Screen Function Menu”.
k AXTRANS Screen Function Menu
• {Switch} ... Switches the display mode of the left side (X-Y coordinate system) of the
AXTRANS screen.
• {Cutout} ... Specifies the trimming range of the left side (X-Y coordinate system) of the
AXTRANS screen.
• {List} ... Returns to the plot list screen.
• {REG} ... Displays a submenu (same as the one on page 6-24) for executing regression
calculation based on plots on the right side (T-Y or T-X coordinate system) of the
AXTRANS screen.
• {P-LINK} ... Causes plots on the left side and right side of the AXTRANS screen that
correspond to each other to flash.