
User Manual
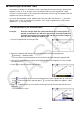
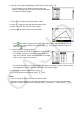
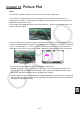
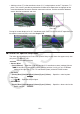
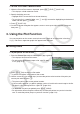
Table Of Contents
- Contents
- Getting Acquainted — Read This First!
- Chapter 1 Basic Operation
- Chapter 2 Manual Calculations
- 1. Basic Calculations
- 2. Special Functions
- 3. Specifying the Angle Unit and Display Format
- 4. Function Calculations
- 5. Numerical Calculations
- 6. Complex Number Calculations
- 7. Binary, Octal, Decimal, and Hexadecimal Calculations with Integers
- 8. Matrix Calculations
- 9. Vector Calculations
- 10. Metric Conversion Calculations
- Chapter 3 List Function
- Chapter 4 Equation Calculations
- Chapter 5 Graphing
- 1. Sample Graphs
- 2. Controlling What Appears on a Graph Screen
- 3. Drawing a Graph
- 4. Saving and Recalling Graph Screen Contents
- 5. Drawing Two Graphs on the Same Screen
- 6. Manual Graphing
- 7. Using Tables
- 8. Modifying a Graph
- 9. Dynamic Graphing
- 10. Graphing a Recursion Formula
- 11. Graphing a Conic Section
- 12. Drawing Dots, Lines, and Text on the Graph Screen (Sketch)
- 13. Function Analysis
- Chapter 6 Statistical Graphs and Calculations
- 1. Before Performing Statistical Calculations
- 2. Calculating and Graphing Single-Variable Statistical Data
- 3. Calculating and Graphing Paired-Variable Statistical Data (Curve Fitting)
- 4. Performing Statistical Calculations
- 5. Tests
- 6. Confidence Interval
- 7. Distribution
- 8. Input and Output Terms of Tests, Confidence Interval, and Distribution
- 9. Statistic Formula
- Chapter 7 Financial Calculation
- Chapter 8 Programming
- Chapter 9 Spreadsheet
- Chapter 10 eActivity
- Chapter 11 Memory Manager
- Chapter 12 System Manager
- Chapter 13 Data Communication
- Chapter 14 Geometry
- Chapter 15 Picture Plot
- Chapter 16 3D Graph Function
- Appendix
- Examination Mode
- E-CON4 Application (English)
- 1. E-CON4 Mode Overview
- 2. Sampling Screen
- 3. Auto Sensor Detection (CLAB Only)
- 4. Selecting a Sensor
- 5. Configuring the Sampling Setup
- 6. Performing Auto Sensor Calibration and Zero Adjustment
- 7. Using a Custom Probe
- 8. Using Setup Memory
- 9. Starting a Sampling Operation
- 10. Using Sample Data Memory
- 11. Using the Graph Analysis Tools to Graph Data
- 12. Graph Analysis Tool Graph Screen Operations
- 13. Calling E-CON4 Functions from an eActivity
15-1
Chapter 15 Picture Plot
Note
fx-CG50 AU/fx-CG20 AU Users: Install the Picture Plot add-in application.
Picture Plot is an application that lets you plot points (that represent coordinates) on a
photograph, illustration, or other graphic and perform various types of analysis based on the
plotted data (coordinate values).
For example, the photograph below shows the nozzles of a fountain shooting thin streams of
water at different angles.
If we view the plane traced by the water of the nozzle closest to us in the photograph as an XY
Cartesian coordinate plane, we then will be able to express any point on the path traced by the
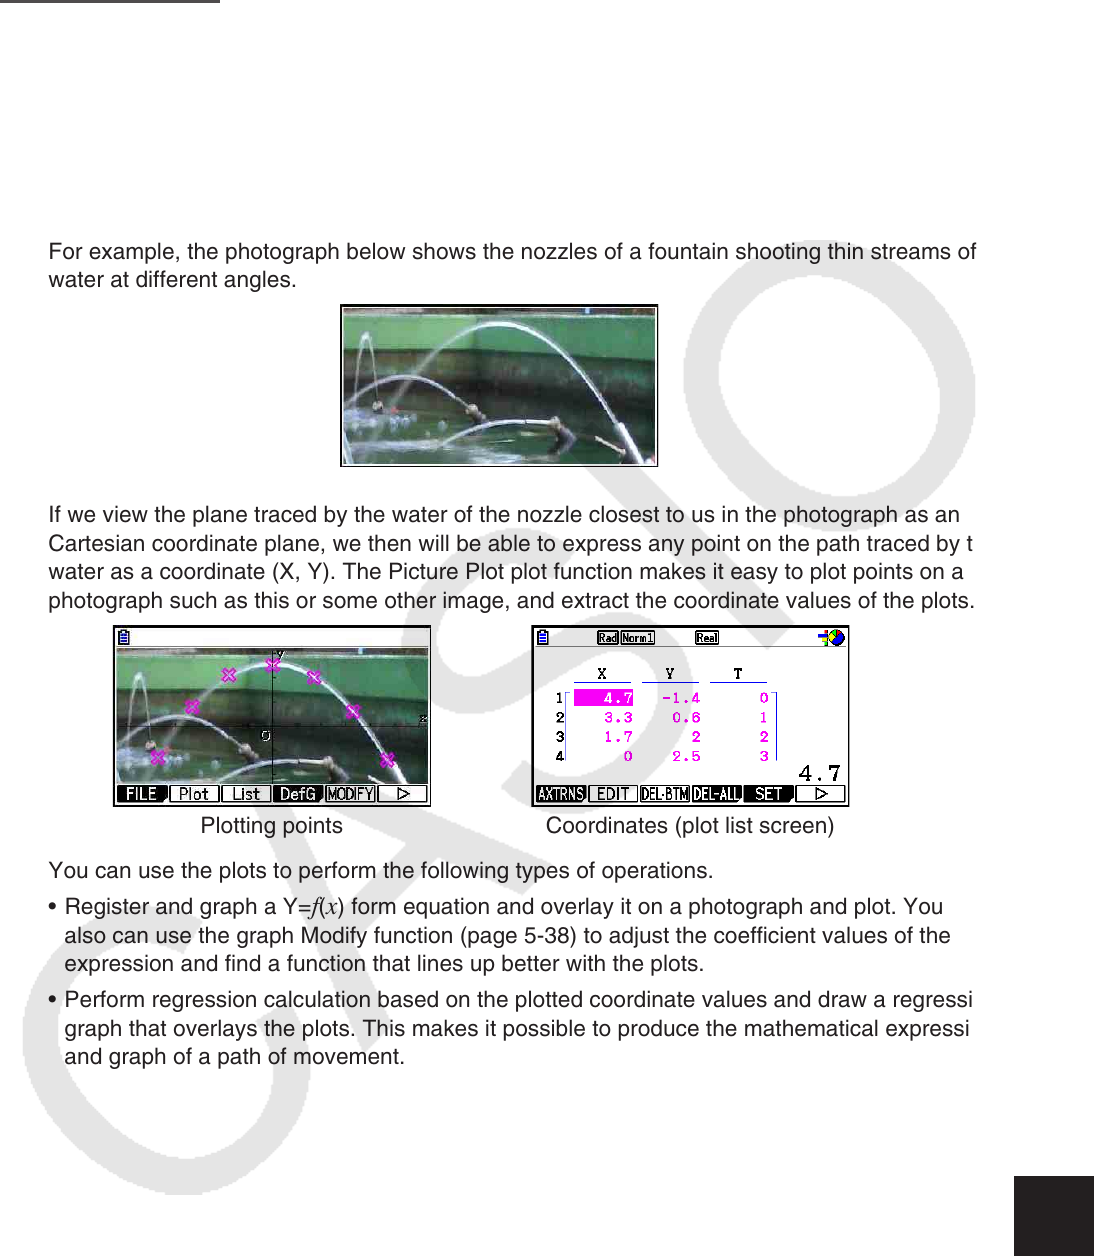
water as a coordinate (X, Y). The Picture Plot plot function makes it easy to plot points on a
photograph such as this or some other image, and extract the coordinate values of the plots.
Plotting points Coordinates (plot list screen)
You can use the plots to perform the following types of operations.
• Register and graph a Y=
f(x) form equation and overlay it on a photograph and plot. You
also can use the graph Modify function (page 5-38) to adjust the coefficient values of the
expression and find a function that lines up better with the plots.
• Perform regression calculation based on the plotted coordinate values and draw a regression
graph that overlays the plots. This makes it possible to produce the mathematical expression
and graph of a path of movement.
15