
User Manual
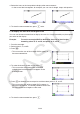
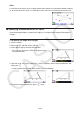

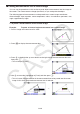
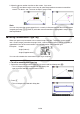

Table Of Contents
- Contents
- Getting Acquainted — Read This First!
- Chapter 1 Basic Operation
- Chapter 2 Manual Calculations
- 1. Basic Calculations
- 2. Special Functions
- 3. Specifying the Angle Unit and Display Format
- 4. Function Calculations
- 5. Numerical Calculations
- 6. Complex Number Calculations
- 7. Binary, Octal, Decimal, and Hexadecimal Calculations with Integers
- 8. Matrix Calculations
- 9. Vector Calculations
- 10. Metric Conversion Calculations
- Chapter 3 List Function
- Chapter 4 Equation Calculations
- Chapter 5 Graphing
- 1. Sample Graphs
- 2. Controlling What Appears on a Graph Screen
- 3. Drawing a Graph
- 4. Saving and Recalling Graph Screen Contents
- 5. Drawing Two Graphs on the Same Screen
- 6. Manual Graphing
- 7. Using Tables
- 8. Modifying a Graph
- 9. Dynamic Graphing
- 10. Graphing a Recursion Formula
- 11. Graphing a Conic Section
- 12. Drawing Dots, Lines, and Text on the Graph Screen (Sketch)
- 13. Function Analysis
- Chapter 6 Statistical Graphs and Calculations
- 1. Before Performing Statistical Calculations
- 2. Calculating and Graphing Single-Variable Statistical Data
- 3. Calculating and Graphing Paired-Variable Statistical Data (Curve Fitting)
- 4. Performing Statistical Calculations
- 5. Tests
- 6. Confidence Interval
- 7. Distribution
- 8. Input and Output Terms of Tests, Confidence Interval, and Distribution
- 9. Statistic Formula
- Chapter 7 Financial Calculation
- Chapter 8 Programming
- Chapter 9 Spreadsheet
- Chapter 10 eActivity
- Chapter 11 Memory Manager
- Chapter 12 System Manager
- Chapter 13 Data Communication
- Chapter 14 Geometry
- Chapter 15 Picture Plot
- Chapter 16 3D Graph Function
- Appendix
- Examination Mode
- E-CON4 Application (English)
- 1. E-CON4 Mode Overview
- 2. Sampling Screen
- 3. Auto Sensor Detection (CLAB Only)
- 4. Selecting a Sensor
- 5. Configuring the Sampling Setup
- 6. Performing Auto Sensor Calibration and Zero Adjustment
- 7. Using a Custom Probe
- 8. Using Setup Memory
- 9. Starting a Sampling Operation
- 10. Using Sample Data Memory
- 11. Using the Graph Analysis Tools to Graph Data
- 12. Graph Analysis Tool Graph Screen Operations
- 13. Calling E-CON4 Functions from an eActivity
14-46
Note
• Performing step 5 in the above procedure not only changes the measurement value, it
also locks the measurement. For details about locking and unlocking measurements, see
“Locking or Unlocking a Measurement of an Object” (page 14-47).
• Specifying a value can change an object in a way that is unexpected. If this happens, try
locking part(s) of the object (page 14-47) or temporarily unlock all objects (Clr Constraint,
page 14-48).
u To specify the length of one side of a triangle
Note
• Specifying any one of the following measurements for the first time in the file you are editing
(or immediately after an all clear operation: 2(Edit) – 6:Clear All) will cause the resulting
object to be resized so it fits within the display area.
- Length of one side of a triangle
- Length of a line segment or vector
- Length of one side of a rectangle, square, polygon, or regular n-gon
- Circumference of a circle or length of an arc
View Window settings will be reconfigured automatically so the size of the object on the
display may not appear to change very much.
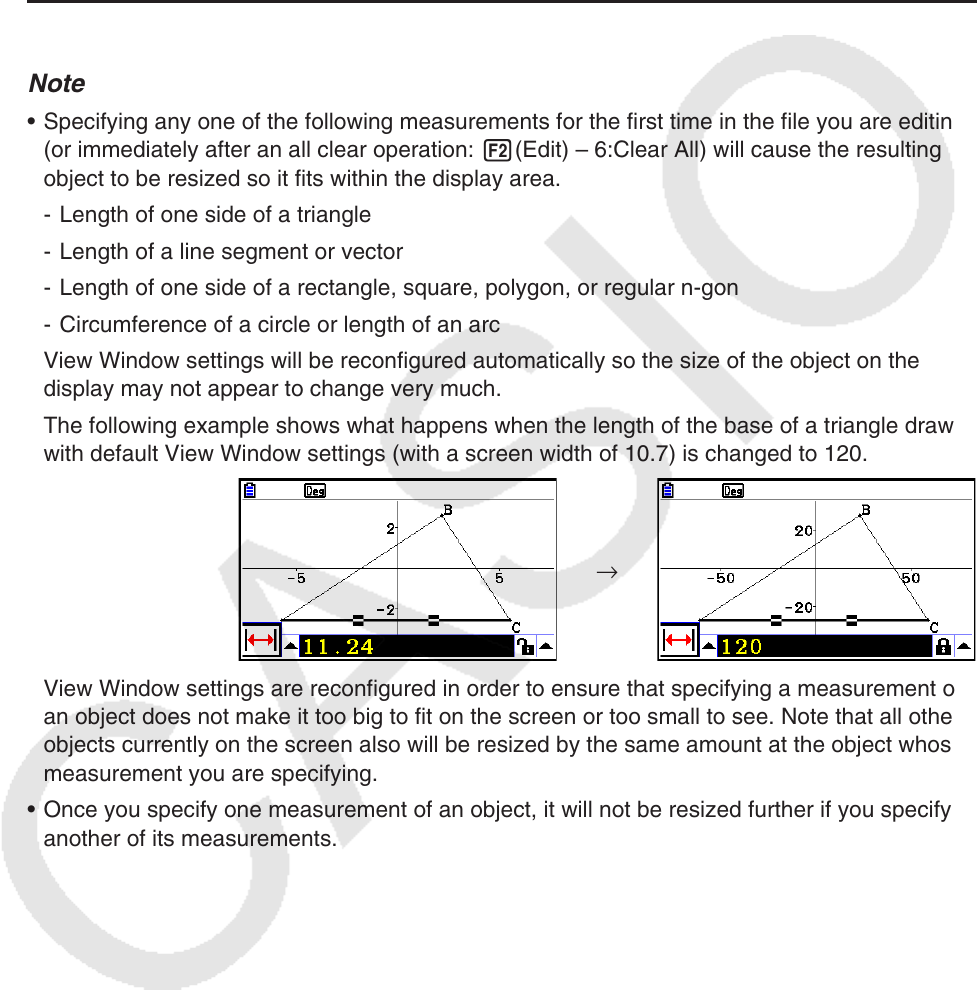
The following example shows what happens when the length of the base of a triangle drawn
with default View Window settings (with a screen width of 10.7) is changed to 120.
→
View Window settings are reconfigured in order to ensure that specifying a measurement of
an object does not make it too big to fit on the screen or too small to see. Note that all other
objects currently on the screen also will be resized by the same amount at the object whose
measurement you are specifying.
• Once you specify one measurement of an object, it will not be resized further if you specify
another of its measurements.