
User Manual
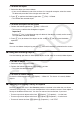
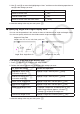
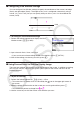
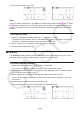
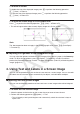
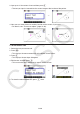
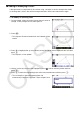
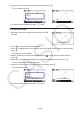

Table Of Contents
- Contents
- Getting Acquainted — Read This First!
- Chapter 1 Basic Operation
- Chapter 2 Manual Calculations
- 1. Basic Calculations
- 2. Special Functions
- 3. Specifying the Angle Unit and Display Format
- 4. Function Calculations
- 5. Numerical Calculations
- 6. Complex Number Calculations
- 7. Binary, Octal, Decimal, and Hexadecimal Calculations with Integers
- 8. Matrix Calculations
- 9. Vector Calculations
- 10. Metric Conversion Calculations
- Chapter 3 List Function
- Chapter 4 Equation Calculations
- Chapter 5 Graphing
- 1. Sample Graphs
- 2. Controlling What Appears on a Graph Screen
- 3. Drawing a Graph
- 4. Saving and Recalling Graph Screen Contents
- 5. Drawing Two Graphs on the Same Screen
- 6. Manual Graphing
- 7. Using Tables
- 8. Modifying a Graph
- 9. Dynamic Graphing
- 10. Graphing a Recursion Formula
- 11. Graphing a Conic Section
- 12. Drawing Dots, Lines, and Text on the Graph Screen (Sketch)
- 13. Function Analysis
- Chapter 6 Statistical Graphs and Calculations
- 1. Before Performing Statistical Calculations
- 2. Calculating and Graphing Single-Variable Statistical Data
- 3. Calculating and Graphing Paired-Variable Statistical Data (Curve Fitting)
- 4. Performing Statistical Calculations
- 5. Tests
- 6. Confidence Interval
- 7. Distribution
- 8. Input and Output Terms of Tests, Confidence Interval, and Distribution
- 9. Statistic Formula
- Chapter 7 Financial Calculation
- Chapter 8 Programming
- Chapter 9 Spreadsheet
- Chapter 10 eActivity
- Chapter 11 Memory Manager
- Chapter 12 System Manager
- Chapter 13 Data Communication
- Chapter 14 Geometry
- Chapter 15 Picture Plot
- Chapter 16 3D Graph Function
- Appendix
- Examination Mode
- E-CON4 Application (English)
- 1. E-CON4 Mode Overview
- 2. Sampling Screen
- 3. Auto Sensor Detection (CLAB Only)
- 4. Selecting a Sensor
- 5. Configuring the Sampling Setup
- 6. Performing Auto Sensor Calibration and Zero Adjustment
- 7. Using a Custom Probe
- 8. Using Setup Memory
- 9. Starting a Sampling Operation
- 10. Using Sample Data Memory
- 11. Using the Graph Analysis Tools to Graph Data
- 12. Graph Analysis Tool Graph Screen Operations
- 13. Calling E-CON4 Functions from an eActivity
14-41
5. Using the Measurement Box
Pressing J displays a measurement box at the bottom of the screen as shown below.
Measurement Box
You can use the measurement box to perform the following operations.
View the measurements of an object
Displaying the measurement box and selecting an object displays combinations of the
following measurements, depending on the type of object you select: coordinates, distance/
length, slope, equation, vector, radius, circumference, perimeter, area, angle, supplementary
angle, tangency, congruence, incidence, or point on curve.
Specify the measurement of part of an object
After you display the measurement box, you can select part of an object and then change
numeric values for the applicable measurement. You can specify the coordinates of a point,
the length of a line segment (distance between endpoints), the angle formed by two lines, etc.
Lock the measurement of part of an object
After you display the measurement box, you can select part of an object and then lock the
applicable measurement. You can lock the coordinates of a point, the length of a line segment,
the angle formed by two lines, etc.
k Viewing the Measurements of an Object
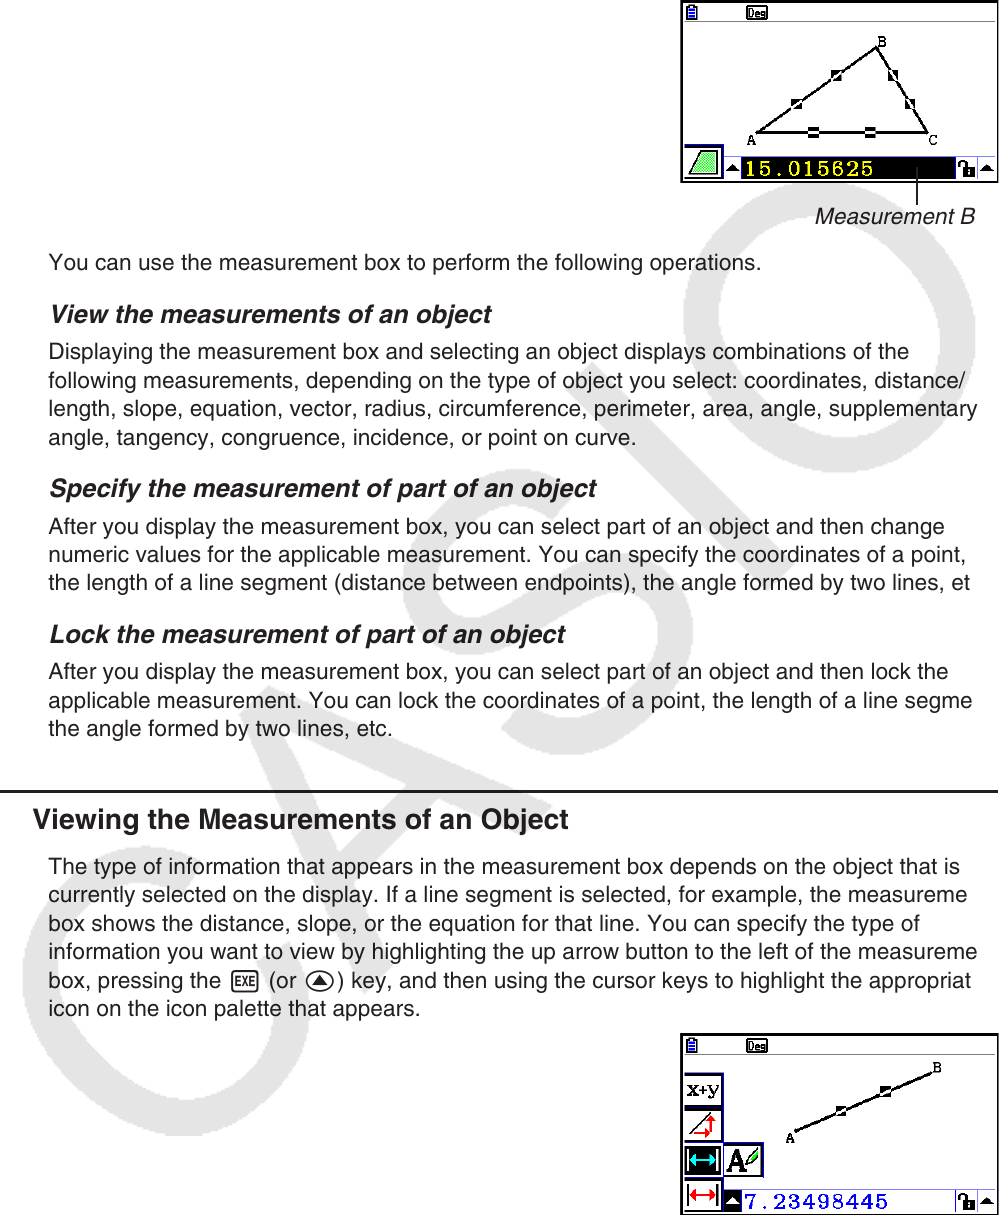
The type of information that appears in the measurement box depends on the object that is
currently selected on the display. If a line segment is selected, for example, the measurement
box shows the distance, slope, or the equation for that line. You can specify the type of
information you want to view by highlighting the up arrow button to the left of the measurement
box, pressing the w (or f) key, and then using the cursor keys to highlight the appropriate
icon on the icon palette that appears.