
User Manual
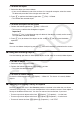
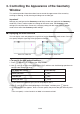
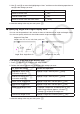
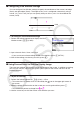
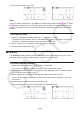
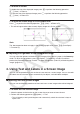
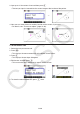
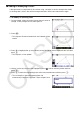
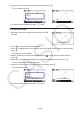

Table Of Contents
- Contents
- Getting Acquainted — Read This First!
- Chapter 1 Basic Operation
- Chapter 2 Manual Calculations
- 1. Basic Calculations
- 2. Special Functions
- 3. Specifying the Angle Unit and Display Format
- 4. Function Calculations
- 5. Numerical Calculations
- 6. Complex Number Calculations
- 7. Binary, Octal, Decimal, and Hexadecimal Calculations with Integers
- 8. Matrix Calculations
- 9. Vector Calculations
- 10. Metric Conversion Calculations
- Chapter 3 List Function
- Chapter 4 Equation Calculations
- Chapter 5 Graphing
- 1. Sample Graphs
- 2. Controlling What Appears on a Graph Screen
- 3. Drawing a Graph
- 4. Saving and Recalling Graph Screen Contents
- 5. Drawing Two Graphs on the Same Screen
- 6. Manual Graphing
- 7. Using Tables
- 8. Modifying a Graph
- 9. Dynamic Graphing
- 10. Graphing a Recursion Formula
- 11. Graphing a Conic Section
- 12. Drawing Dots, Lines, and Text on the Graph Screen (Sketch)
- 13. Function Analysis
- Chapter 6 Statistical Graphs and Calculations
- 1. Before Performing Statistical Calculations
- 2. Calculating and Graphing Single-Variable Statistical Data
- 3. Calculating and Graphing Paired-Variable Statistical Data (Curve Fitting)
- 4. Performing Statistical Calculations
- 5. Tests
- 6. Confidence Interval
- 7. Distribution
- 8. Input and Output Terms of Tests, Confidence Interval, and Distribution
- 9. Statistic Formula
- Chapter 7 Financial Calculation
- Chapter 8 Programming
- Chapter 9 Spreadsheet
- Chapter 10 eActivity
- Chapter 11 Memory Manager
- Chapter 12 System Manager
- Chapter 13 Data Communication
- Chapter 14 Geometry
- Chapter 15 Picture Plot
- Chapter 16 3D Graph Function
- Appendix
- Examination Mode
- E-CON4 Application (English)
- 1. E-CON4 Mode Overview
- 2. Sampling Screen
- 3. Auto Sensor Detection (CLAB Only)
- 4. Selecting a Sensor
- 5. Configuring the Sampling Setup
- 6. Performing Auto Sensor Calibration and Zero Adjustment
- 7. Using a Custom Probe
- 8. Using Setup Memory
- 9. Starting a Sampling Operation
- 10. Using Sample Data Memory
- 11. Using the Graph Analysis Tools to Graph Data
- 12. Graph Analysis Tool Graph Screen Operations
- 13. Calling E-CON4 Functions from an eActivity
14-37
u To zoom in and out
To double the size of the displayed image, press + or perform the following operation:
1e(View) – 4:Zoom In.
To halve the size of the displayed image, press - or perform the following operation:
1e(View) – 5:Zoom Out.
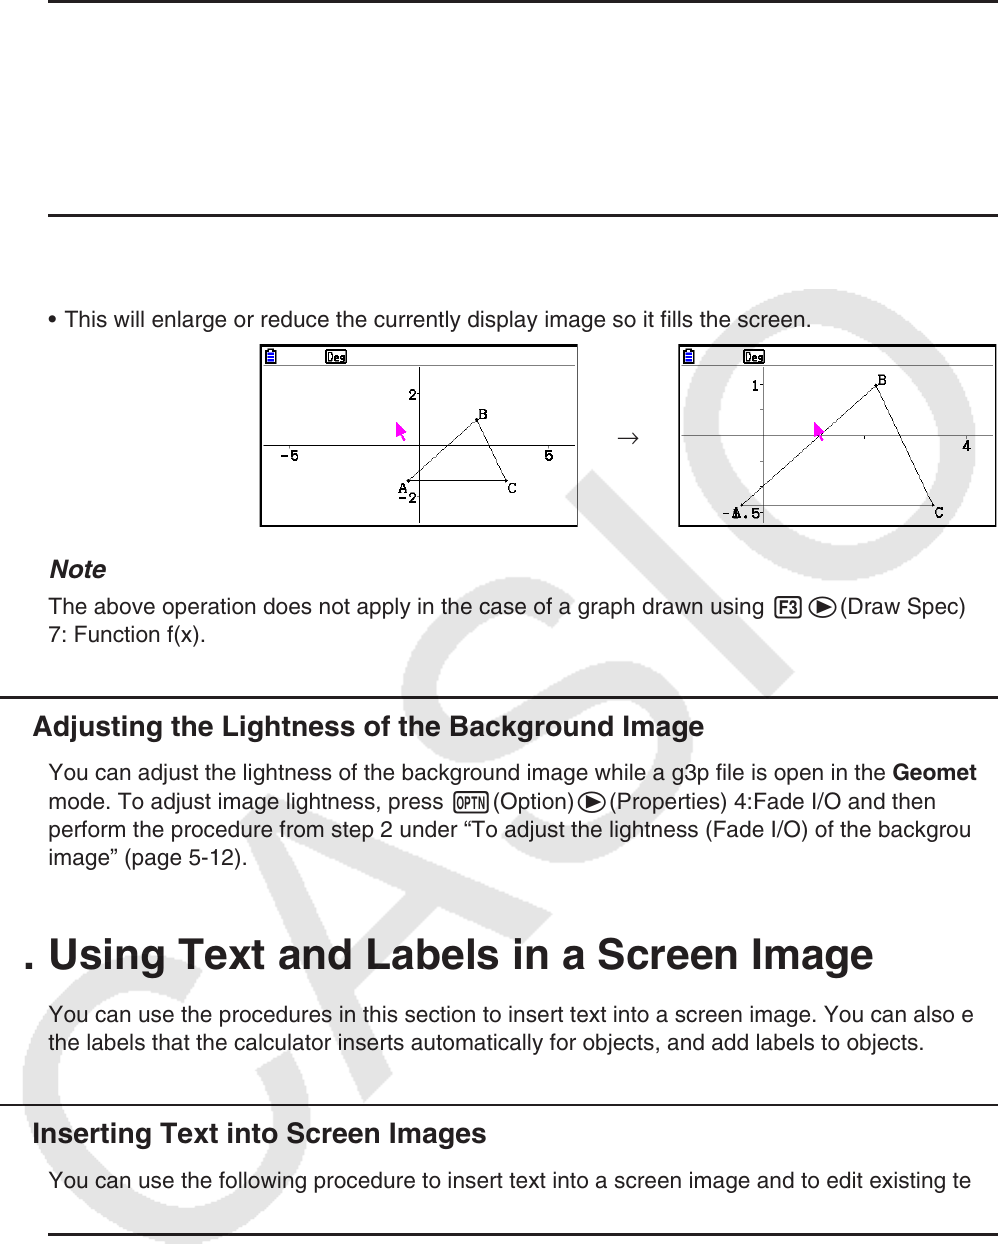
u To zoom the screen image to fit the window area
Press - or perform the following operation: 1e(View) – 6:Zoom to Fit.
• This will enlarge or reduce the currently display image so it fills the screen.
→
Note
The above operation does not apply in the case of a graph drawn using 3e(Draw Spec)
7: Function f(x).
k Adjusting the Lightness of the Background Image
You can adjust the lightness of the background image while a g3p file is open in the Geometry
mode. To adjust image lightness, press K(Option)e(Properties) 4:Fade I/O and then
perform the procedure from step 2 under “To adjust the lightness (Fade I/O) of the background
image” (page 5-12).
4. Using Text and Labels in a Screen Image
You can use the procedures in this section to insert text into a screen image. You can also edit
the labels that the calculator inserts automatically for objects, and add labels to objects.
k Inserting Text into Screen Images
You can use the following procedure to insert text into a screen image and to edit existing text.
u To insert text into a screen image
1. Move the pointer to the location on the screen where you want to insert the text.
2. Perform the following operation: K(Option) – 1:Text.
• This will display a text input dialog box and automatically switch the calculator’s keys to
Alpha Lock.