
User Manual
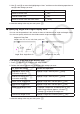
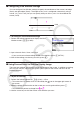

Table Of Contents
- Contents
- Getting Acquainted — Read This First!
- Chapter 1 Basic Operation
- Chapter 2 Manual Calculations
- 1. Basic Calculations
- 2. Special Functions
- 3. Specifying the Angle Unit and Display Format
- 4. Function Calculations
- 5. Numerical Calculations
- 6. Complex Number Calculations
- 7. Binary, Octal, Decimal, and Hexadecimal Calculations with Integers
- 8. Matrix Calculations
- 9. Vector Calculations
- 10. Metric Conversion Calculations
- Chapter 3 List Function
- Chapter 4 Equation Calculations
- Chapter 5 Graphing
- 1. Sample Graphs
- 2. Controlling What Appears on a Graph Screen
- 3. Drawing a Graph
- 4. Saving and Recalling Graph Screen Contents
- 5. Drawing Two Graphs on the Same Screen
- 6. Manual Graphing
- 7. Using Tables
- 8. Modifying a Graph
- 9. Dynamic Graphing
- 10. Graphing a Recursion Formula
- 11. Graphing a Conic Section
- 12. Drawing Dots, Lines, and Text on the Graph Screen (Sketch)
- 13. Function Analysis
- Chapter 6 Statistical Graphs and Calculations
- 1. Before Performing Statistical Calculations
- 2. Calculating and Graphing Single-Variable Statistical Data
- 3. Calculating and Graphing Paired-Variable Statistical Data (Curve Fitting)
- 4. Performing Statistical Calculations
- 5. Tests
- 6. Confidence Interval
- 7. Distribution
- 8. Input and Output Terms of Tests, Confidence Interval, and Distribution
- 9. Statistic Formula
- Chapter 7 Financial Calculation
- Chapter 8 Programming
- Chapter 9 Spreadsheet
- Chapter 10 eActivity
- Chapter 11 Memory Manager
- Chapter 12 System Manager
- Chapter 13 Data Communication
- Chapter 14 Geometry
- Chapter 15 Picture Plot
- Chapter 16 3D Graph Function
- Appendix
- Examination Mode
- E-CON4 Application (English)
- 1. E-CON4 Mode Overview
- 2. Sampling Screen
- 3. Auto Sensor Detection (CLAB Only)
- 4. Selecting a Sensor
- 5. Configuring the Sampling Setup
- 6. Performing Auto Sensor Calibration and Zero Adjustment
- 7. Using a Custom Probe
- 8. Using Setup Memory
- 9. Starting a Sampling Operation
- 10. Using Sample Data Memory
- 11. Using the Graph Analysis Tools to Graph Data
- 12. Graph Analysis Tool Graph Screen Operations
- 13. Calling E-CON4 Functions from an eActivity
14-35
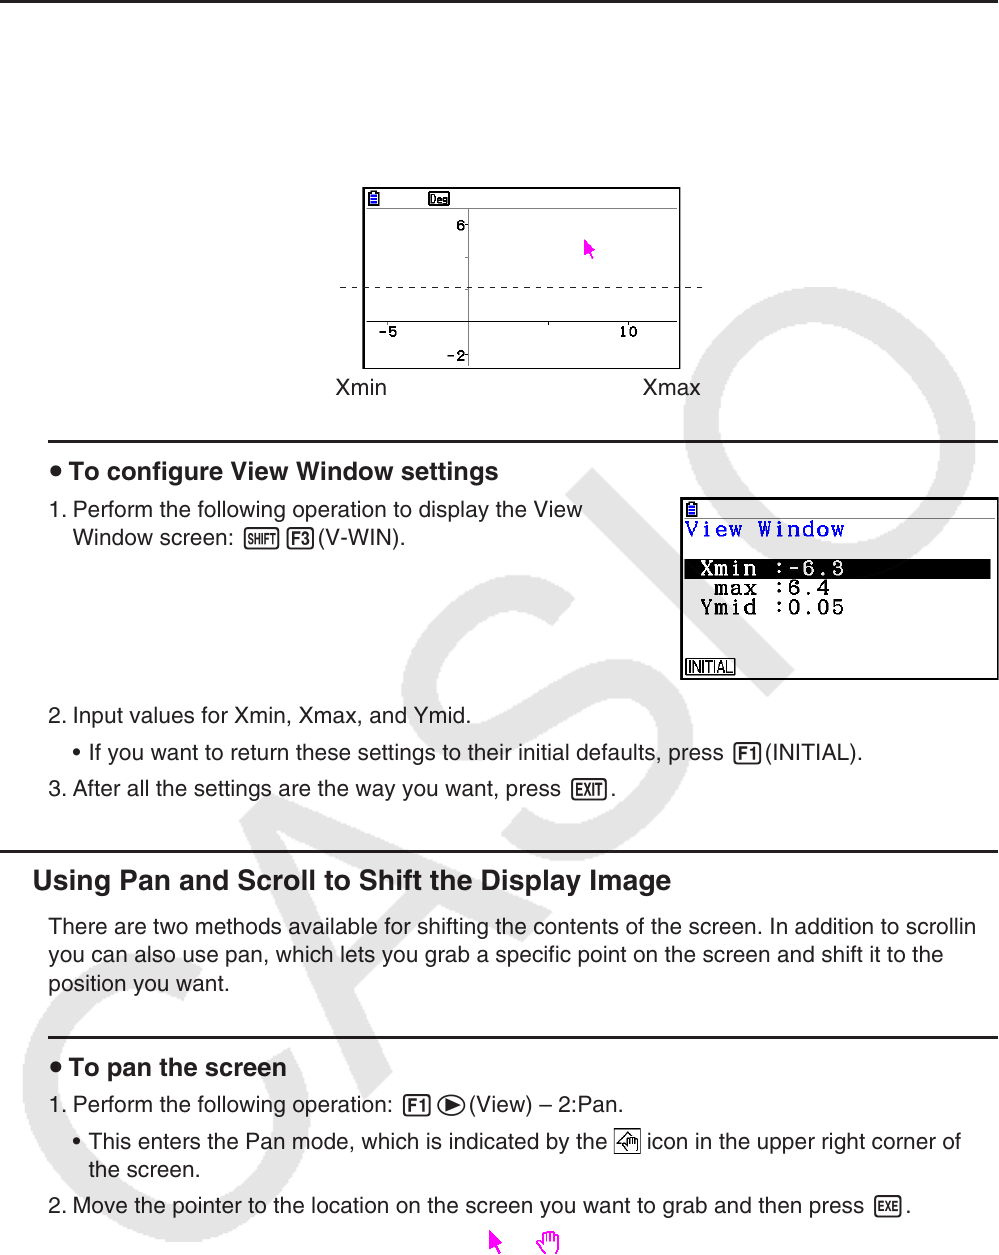
k Configuring View Window Settings
You can configure View Window settings to specify the coordinates of the screen’s left edge
(Xmin) and right edges (Xmax). The length of the
y-axis is configured automatically using a
ratio of 1:2 (
y-axis:x-axis), but you can specify what part of the y-axis is in the middle of the
screen (Ymid).
Ymid
Xmin Xmax
u To configure View Window settings
1. Perform the following operation to display the View
Window screen: !3(V-WIN).
2. Input values for Xmin, Xmax, and Ymid.
• If you want to return these settings to their initial defaults, press 1(INITIAL).
3. After all the settings are the way you want, press J.
k Using Pan and Scroll to Shift the Display Image
There are two methods available for shifting the contents of the screen. In addition to scrolling,
you can also use pan, which lets you grab a specific point on the screen and shift it to the
position you want.
u To pan the screen
1. Perform the following operation: 1e(View) – 2:Pan.
• This enters the Pan mode, which is indicated by the
icon in the upper right corner of
the screen.
2. Move the pointer to the location on the screen you want to grab and then press w.
• This causes the pointer to change from
to .
3. Use the cursor keys to shift the screen in the direction you want.