
User Manual


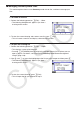

Table Of Contents
- Contents
- Getting Acquainted — Read This First!
- Chapter 1 Basic Operation
- Chapter 2 Manual Calculations
- 1. Basic Calculations
- 2. Special Functions
- 3. Specifying the Angle Unit and Display Format
- 4. Function Calculations
- 5. Numerical Calculations
- 6. Complex Number Calculations
- 7. Binary, Octal, Decimal, and Hexadecimal Calculations with Integers
- 8. Matrix Calculations
- 9. Vector Calculations
- 10. Metric Conversion Calculations
- Chapter 3 List Function
- Chapter 4 Equation Calculations
- Chapter 5 Graphing
- 1. Sample Graphs
- 2. Controlling What Appears on a Graph Screen
- 3. Drawing a Graph
- 4. Saving and Recalling Graph Screen Contents
- 5. Drawing Two Graphs on the Same Screen
- 6. Manual Graphing
- 7. Using Tables
- 8. Modifying a Graph
- 9. Dynamic Graphing
- 10. Graphing a Recursion Formula
- 11. Graphing a Conic Section
- 12. Drawing Dots, Lines, and Text on the Graph Screen (Sketch)
- 13. Function Analysis
- Chapter 6 Statistical Graphs and Calculations
- 1. Before Performing Statistical Calculations
- 2. Calculating and Graphing Single-Variable Statistical Data
- 3. Calculating and Graphing Paired-Variable Statistical Data (Curve Fitting)
- 4. Performing Statistical Calculations
- 5. Tests
- 6. Confidence Interval
- 7. Distribution
- 8. Input and Output Terms of Tests, Confidence Interval, and Distribution
- 9. Statistic Formula
- Chapter 7 Financial Calculation
- Chapter 8 Programming
- Chapter 9 Spreadsheet
- Chapter 10 eActivity
- Chapter 11 Memory Manager
- Chapter 12 System Manager
- Chapter 13 Data Communication
- Chapter 14 Geometry
- Chapter 15 Picture Plot
- Chapter 16 3D Graph Function
- Appendix
- Examination Mode
- E-CON4 Application (English)
- 1. E-CON4 Mode Overview
- 2. Sampling Screen
- 3. Auto Sensor Detection (CLAB Only)
- 4. Selecting a Sensor
- 5. Configuring the Sampling Setup
- 6. Performing Auto Sensor Calibration and Zero Adjustment
- 7. Using a Custom Probe
- 8. Using Setup Memory
- 9. Starting a Sampling Operation
- 10. Using Sample Data Memory
- 11. Using the Graph Analysis Tools to Graph Data
- 12. Graph Analysis Tool Graph Screen Operations
- 13. Calling E-CON4 Functions from an eActivity
14-8
k Displaying a Geometry Mode Screen Background Image
In the Geometry mode, you can open an image file (g3p) and use it as a background image
for a Geometry mode drawing.
• If you open a g3p file, draw something, and then save the result to a file, the g3p file will be
saved along with the Geometry mode data.
• After opening a background image, you adjust its lightness on the display. See “Adjusting the
Lightness of the Background Image” (page 14-37).
• Once you add a background image and save it, you will not be able to change the
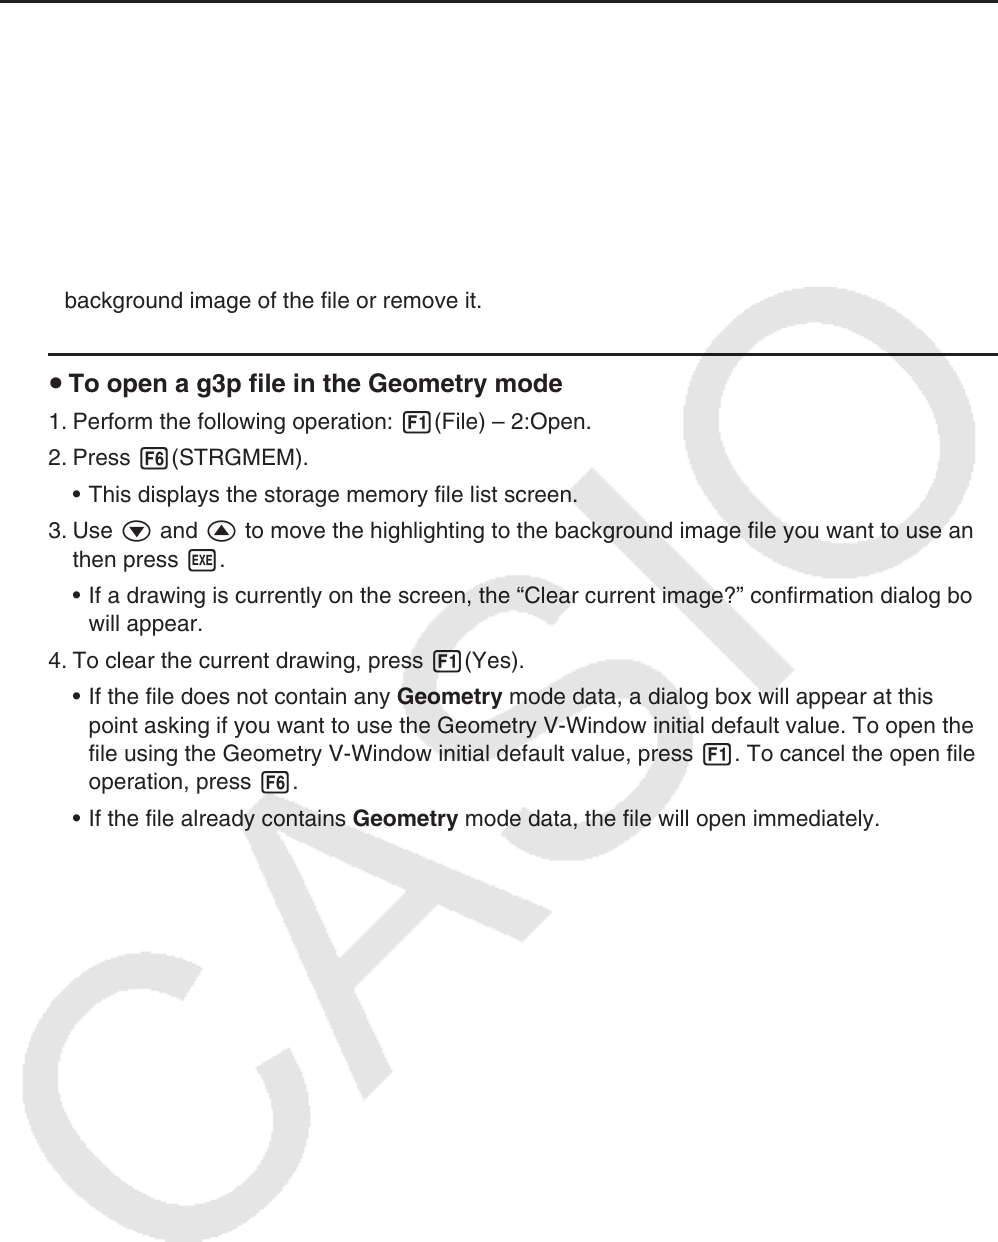
background image of the file or remove it.
u To open a g3p file in the Geometry mode
1. Perform the following operation: 1(File) – 2:Open.
2. Press 6(STRGMEM).
• This displays the storage memory file list screen.
3. Use c and f to move the highlighting to the background image file you want to use and
then press w.
• If a drawing is currently on the screen, the “Clear current image?” confirmation dialog box
will appear.
4. To clear the current drawing, press 1(Yes).
• If the file does not contain any Geometry mode data, a dialog box will appear at this
point asking if you want to use the Geometry V-Window initial default value. To open the
file using the Geometry V-Window initial default value, press 1. To cancel the open file
operation, press 6.
• If the file already contains Geometry mode data, the file will open immediately.