
User Manual
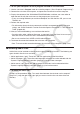
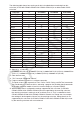
Table Of Contents
- Contents
- Getting Acquainted — Read This First!
- Chapter 1 Basic Operation
- Chapter 2 Manual Calculations
- 1. Basic Calculations
- 2. Special Functions
- 3. Specifying the Angle Unit and Display Format
- 4. Function Calculations
- 5. Numerical Calculations
- 6. Complex Number Calculations
- 7. Binary, Octal, Decimal, and Hexadecimal Calculations with Integers
- 8. Matrix Calculations
- 9. Vector Calculations
- 10. Metric Conversion Calculations
- Chapter 3 List Function
- Chapter 4 Equation Calculations
- Chapter 5 Graphing
- 1. Sample Graphs
- 2. Controlling What Appears on a Graph Screen
- 3. Drawing a Graph
- 4. Saving and Recalling Graph Screen Contents
- 5. Drawing Two Graphs on the Same Screen
- 6. Manual Graphing
- 7. Using Tables
- 8. Modifying a Graph
- 9. Dynamic Graphing
- 10. Graphing a Recursion Formula
- 11. Graphing a Conic Section
- 12. Drawing Dots, Lines, and Text on the Graph Screen (Sketch)
- 13. Function Analysis
- Chapter 6 Statistical Graphs and Calculations
- 1. Before Performing Statistical Calculations
- 2. Calculating and Graphing Single-Variable Statistical Data
- 3. Calculating and Graphing Paired-Variable Statistical Data (Curve Fitting)
- 4. Performing Statistical Calculations
- 5. Tests
- 6. Confidence Interval
- 7. Distribution
- 8. Input and Output Terms of Tests, Confidence Interval, and Distribution
- 9. Statistic Formula
- Chapter 7 Financial Calculation
- Chapter 8 Programming
- Chapter 9 Spreadsheet
- Chapter 10 eActivity
- Chapter 11 Memory Manager
- Chapter 12 System Manager
- Chapter 13 Data Communication
- Chapter 14 Geometry
- Chapter 15 Picture Plot
- Chapter 16 3D Graph Function
- Appendix
- Examination Mode
- E-CON4 Application (English)
- 1. E-CON4 Mode Overview
- 2. Sampling Screen
- 3. Auto Sensor Detection (CLAB Only)
- 4. Selecting a Sensor
- 5. Configuring the Sampling Setup
- 6. Performing Auto Sensor Calibration and Zero Adjustment
- 7. Using a Custom Probe
- 8. Using Setup Memory
- 9. Starting a Sampling Operation
- 10. Using Sample Data Memory
- 11. Using the Graph Analysis Tools to Graph Data
- 12. Graph Analysis Tool Graph Screen Operations
- 13. Calling E-CON4 Functions from an eActivity
13-14
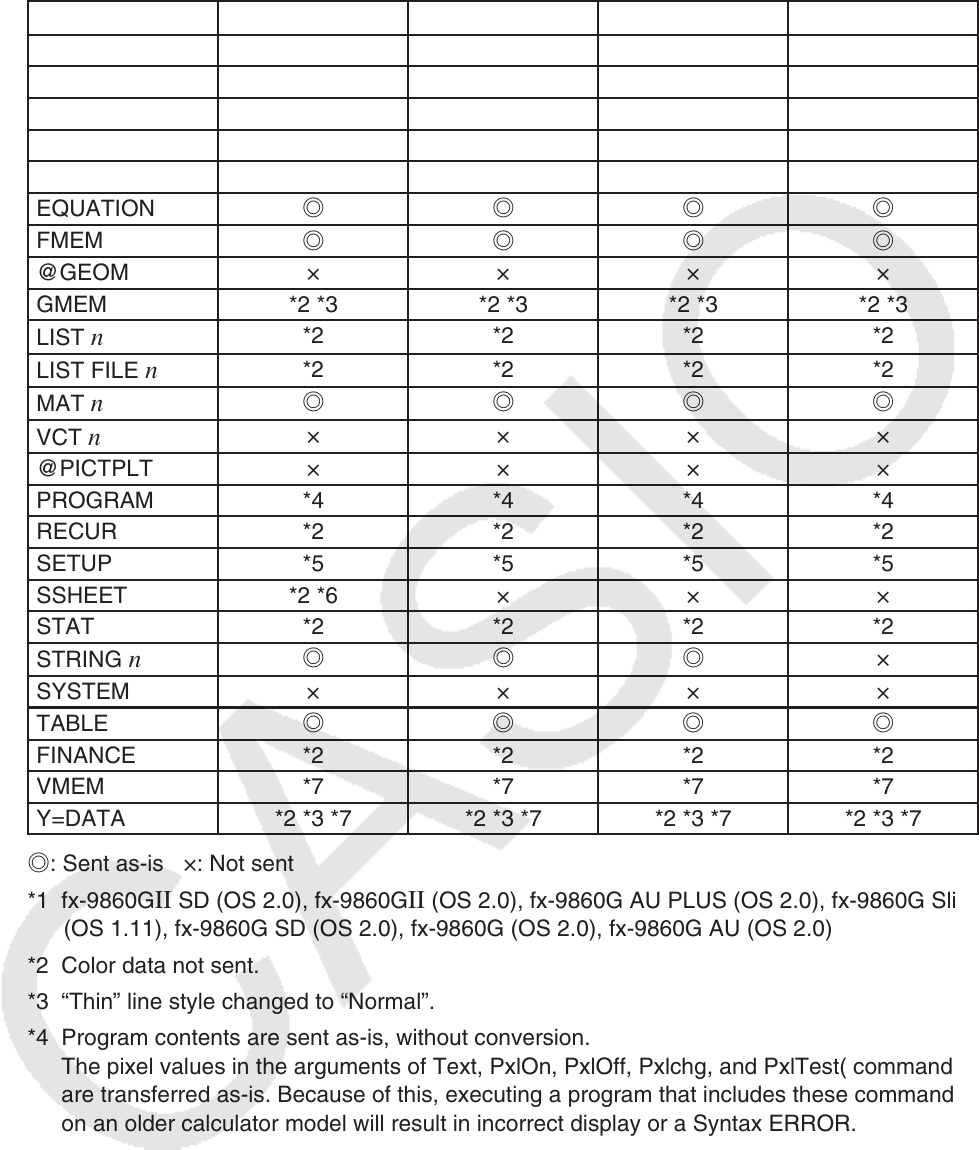
The following table shows how each type of data is handled when transferring from this
calculator (
fx-CG10/fx-CG20/fx-CG20 AU/fx-CG50/fx-CG50 AU) to an older model CASIO
calculator.
Data Item *1
fx-9750G
II fx-7400GII
CFX-9850G
@3DGRAPH × × × ×
ALPHAMEM
◎◎◎◎
CONICS *2 *2 × *2
DYNA × × × ×
E-CON4 *8 *8 × ×
EQUATION
◎◎◎◎
FMEM
◎◎◎◎
@GEOM × × × ×
GMEM *2 *3 *2 *3 *2 *3 *2 *3
LIST
n
*2 *2 *2 *2
LIST FILE
n
*2 *2 *2 *2
MAT
n
◎◎◎◎
VCT
n
××××
@PICTPLT × × × ×
PROGRAM *4 *4 *4 *4
RECUR *2 *2 *2 *2
SETUP *5 *5 *5 *5
SSHEET *2 *6 × × ×
STAT *2 *2 *2 *2
STRING
n
◎◎◎
×
SYSTEM × × × ×
TABLE
◎◎◎◎
FINANCE *2 *2 *2 *2
VMEM *7 *7 *7 *7
Y=DATA *2 *3 *7 *2 *3 *7 *2 *3 *7 *2 *3 *7
◎: Sent as-is ×: Not sent
*1 fx-9860G
II SD (OS 2.0), fx-9860GII (OS 2.0), fx-9860G AU PLUS (OS 2.0), fx-9860G Slim
(OS 1.11), fx-9860G SD (OS 2.0), fx-9860G (OS 2.0), fx-9860G AU (OS 2.0)
*2 Color data not sent.
*3 “Thin” line style changed to “Normal”.
*4 Program contents are sent as-is, without conversion.
The pixel values in the arguments of Text, PxlOn, PxlOff, Pxlchg, and PxlTest( commands
are transferred as-is. Because of this, executing a program that includes these commands
on an older calculator model will result in incorrect display or a Syntax ERROR.
*5 When a Setup item is configured to settings supported by this calculator (
fx-CG10/fx-
CG20/fx-CG20 AU/fx-CG50/fx-CG50 AU) but not supported by the receiving calculator,
the receiving calculator’s setting is set to its default value. If “Thin” is selected for the fx-
CG10/fx-CG20/fx-CG20 AU/fx-CG50/fx-CG50 AU “Sketch Line” Setup item, for example,
the setting will be changed to “Normal” on the receiving calculator. Setup items that are
supported by this calculator (fx-CG10/fx-CG20/fx-CG20 AU/fx-CG50/fx-CG50 AU) but not
by the receiving calculator are not transferred.