
User Manual
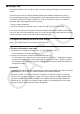
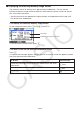
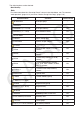
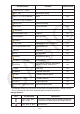
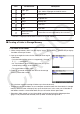
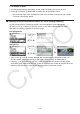
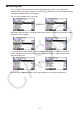
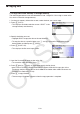
Table Of Contents
- Contents
- Getting Acquainted — Read This First!
- Chapter 1 Basic Operation
- Chapter 2 Manual Calculations
- 1. Basic Calculations
- 2. Special Functions
- 3. Specifying the Angle Unit and Display Format
- 4. Function Calculations
- 5. Numerical Calculations
- 6. Complex Number Calculations
- 7. Binary, Octal, Decimal, and Hexadecimal Calculations with Integers
- 8. Matrix Calculations
- 9. Vector Calculations
- 10. Metric Conversion Calculations
- Chapter 3 List Function
- Chapter 4 Equation Calculations
- Chapter 5 Graphing
- 1. Sample Graphs
- 2. Controlling What Appears on a Graph Screen
- 3. Drawing a Graph
- 4. Saving and Recalling Graph Screen Contents
- 5. Drawing Two Graphs on the Same Screen
- 6. Manual Graphing
- 7. Using Tables
- 8. Modifying a Graph
- 9. Dynamic Graphing
- 10. Graphing a Recursion Formula
- 11. Graphing a Conic Section
- 12. Drawing Dots, Lines, and Text on the Graph Screen (Sketch)
- 13. Function Analysis
- Chapter 6 Statistical Graphs and Calculations
- 1. Before Performing Statistical Calculations
- 2. Calculating and Graphing Single-Variable Statistical Data
- 3. Calculating and Graphing Paired-Variable Statistical Data (Curve Fitting)
- 4. Performing Statistical Calculations
- 5. Tests
- 6. Confidence Interval
- 7. Distribution
- 8. Input and Output Terms of Tests, Confidence Interval, and Distribution
- 9. Statistic Formula
- Chapter 7 Financial Calculation
- Chapter 8 Programming
- Chapter 9 Spreadsheet
- Chapter 10 eActivity
- Chapter 11 Memory Manager
- Chapter 12 System Manager
- Chapter 13 Data Communication
- Chapter 14 Geometry
- Chapter 15 Picture Plot
- Chapter 16 3D Graph Function
- Appendix
- Examination Mode
- E-CON4 Application (English)
- 1. E-CON4 Mode Overview
- 2. Sampling Screen
- 3. Auto Sensor Detection (CLAB Only)
- 4. Selecting a Sensor
- 5. Configuring the Sampling Setup
- 6. Performing Auto Sensor Calibration and Zero Adjustment
- 7. Using a Custom Probe
- 8. Using Setup Memory
- 9. Starting a Sampling Operation
- 10. Using Sample Data Memory
- 11. Using the Graph Analysis Tools to Graph Data
- 12. Graph Analysis Tool Graph Screen Operations
- 13. Calling E-CON4 Functions from an eActivity
11-2
• Use the cursor f and c keys to move the highlighting and check the number of bytes
used by each type of data.
• The status bar shows the remaining capacity of the currently displayed memory area (main
or storage).
• If the name of a file transferred to storage memory from your computer or other source
has a file name that is more than eight characters long, its name will abbreviated to
eight characters when displayed on the storage memory information screen (Example:
AAAABBBBCC.txt > AAAABB~1.txt). Also, if a file name extension has more than three
characters, everything after the third character of the file name extension will be trimmed off.
• Up to 300 files per folder can be displayed on the main memory information screen. If a
folder has more than 300 files and you need to display them all, divide them among multiple
folders so the total number of files in a single folder is not greater than 300.
• Up to 200 files per folder can be displayed on the storage memory information screen. If a
folder has more than 200 files and you need to display them all, divide them among multiple
folders so the total number of files in a single folder is not greater than 200.
• Though you can create folders on your computer nested to more than three levels in storage
memory, this calculator will display only up to the third level.
• Moving the highlighting to a data group or folder and pressing w will display the data group
or folder contents. Pressing J will return to the previous screen.
• While storage memory folder contents are displayed, the top line of the screen shows the file
path to the current directory level. “SMEM” stands for “Storage Memory”.
• The following are characters that can be used in file names and folder names.
A-Z, a-z, 0-9, !, #, $, %, ', ,(comma), (, ), +, –, ., ;, =, @, [, ], ^, _, `, ~, space