
User Manual
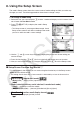
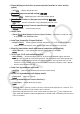
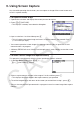
Table Of Contents
- Contents
- Getting Acquainted — Read This First!
- Chapter 1 Basic Operation
- Chapter 2 Manual Calculations
- 1. Basic Calculations
- 2. Special Functions
- 3. Specifying the Angle Unit and Display Format
- 4. Function Calculations
- 5. Numerical Calculations
- 6. Complex Number Calculations
- 7. Binary, Octal, Decimal, and Hexadecimal Calculations with Integers
- 8. Matrix Calculations
- 9. Vector Calculations
- 10. Metric Conversion Calculations
- Chapter 3 List Function
- Chapter 4 Equation Calculations
- Chapter 5 Graphing
- 1. Sample Graphs
- 2. Controlling What Appears on a Graph Screen
- 3. Drawing a Graph
- 4. Saving and Recalling Graph Screen Contents
- 5. Drawing Two Graphs on the Same Screen
- 6. Manual Graphing
- 7. Using Tables
- 8. Modifying a Graph
- 9. Dynamic Graphing
- 10. Graphing a Recursion Formula
- 11. Graphing a Conic Section
- 12. Drawing Dots, Lines, and Text on the Graph Screen (Sketch)
- 13. Function Analysis
- Chapter 6 Statistical Graphs and Calculations
- 1. Before Performing Statistical Calculations
- 2. Calculating and Graphing Single-Variable Statistical Data
- 3. Calculating and Graphing Paired-Variable Statistical Data (Curve Fitting)
- 4. Performing Statistical Calculations
- 5. Tests
- 6. Confidence Interval
- 7. Distribution
- 8. Input and Output Terms of Tests, Confidence Interval, and Distribution
- 9. Statistic Formula
- Chapter 7 Financial Calculation
- Chapter 8 Programming
- Chapter 9 Spreadsheet
- Chapter 10 eActivity
- Chapter 11 Memory Manager
- Chapter 12 System Manager
- Chapter 13 Data Communication
- Chapter 14 Geometry
- Chapter 15 Picture Plot
- Chapter 16 3D Graph Function
- Appendix
- Examination Mode
- E-CON4 Application (English)
- 1. E-CON4 Mode Overview
- 2. Sampling Screen
- 3. Auto Sensor Detection (CLAB Only)
- 4. Selecting a Sensor
- 5. Configuring the Sampling Setup
- 6. Performing Auto Sensor Calibration and Zero Adjustment
- 7. Using a Custom Probe
- 8. Using Setup Memory
- 9. Starting a Sampling Operation
- 10. Using Sample Data Memory
- 11. Using the Graph Analysis Tools to Graph Data
- 12. Graph Analysis Tool Graph Screen Operations
- 13. Calling E-CON4 Functions from an eActivity
1-35
8. Using the Setup Screen
The mode’s Setup screen shows the current status of mode settings and lets you make any
changes you want. The following procedure shows how to change a setup.
u To change a mode setup
1. Select the icon you want and press w to enter a mode and display its initial screen. Here
we will enter the Run-Matrix mode.
2. Press !m(SET UP) to display the mode’s Setup
screen.
• This Setup screen is just one possible example. Actual
Setup screen contents will differ according to the mode
you are in and that mode’s current settings.
3. Use the f and c cursor keys to move the highlighting to the item whose setting you
want to change.
4. Press the function key (1 to 6) that is marked with the setting you want to make.
5. After you are finished making any changes you want, press J to exit the Setup screen.
k Setup Screen Function Key Menus
This section details the settings you can make using the function keys in the Setup screen.
indicates default setting.
• The setting of each item with a frame around it is indicated by an icon in the status bar.
u
Input/Output
(input/output mode)
• {Math}/{Line} ... {Math}/{Linear} input/output mode
u Mode (calculation/binary, octal, decimal, hexadecimal mode)
• {Comp} ... {arithmetic calculation mode}
• {Dec}/{Hex}/{Bin}/{Oct} ... {decimal}/{hexadecimal}/{binary}/{octal}
u
Frac Result
(fraction result display format)
• {d/c}/{ab/c} ... {improper}/{mixed} fraction