
User Manual
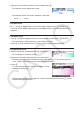
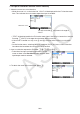
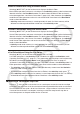
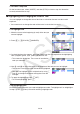
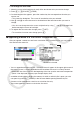
Table Of Contents
- Contents
- Getting Acquainted — Read This First!
- Chapter 1 Basic Operation
- Chapter 2 Manual Calculations
- 1. Basic Calculations
- 2. Special Functions
- 3. Specifying the Angle Unit and Display Format
- 4. Function Calculations
- 5. Numerical Calculations
- 6. Complex Number Calculations
- 7. Binary, Octal, Decimal, and Hexadecimal Calculations with Integers
- 8. Matrix Calculations
- 9. Vector Calculations
- 10. Metric Conversion Calculations
- Chapter 3 List Function
- Chapter 4 Equation Calculations
- Chapter 5 Graphing
- 1. Sample Graphs
- 2. Controlling What Appears on a Graph Screen
- 3. Drawing a Graph
- 4. Saving and Recalling Graph Screen Contents
- 5. Drawing Two Graphs on the Same Screen
- 6. Manual Graphing
- 7. Using Tables
- 8. Modifying a Graph
- 9. Dynamic Graphing
- 10. Graphing a Recursion Formula
- 11. Graphing a Conic Section
- 12. Drawing Dots, Lines, and Text on the Graph Screen (Sketch)
- 13. Function Analysis
- Chapter 6 Statistical Graphs and Calculations
- 1. Before Performing Statistical Calculations
- 2. Calculating and Graphing Single-Variable Statistical Data
- 3. Calculating and Graphing Paired-Variable Statistical Data (Curve Fitting)
- 4. Performing Statistical Calculations
- 5. Tests
- 6. Confidence Interval
- 7. Distribution
- 8. Input and Output Terms of Tests, Confidence Interval, and Distribution
- 9. Statistic Formula
- Chapter 7 Financial Calculation
- Chapter 8 Programming
- Chapter 9 Spreadsheet
- Chapter 10 eActivity
- Chapter 11 Memory Manager
- Chapter 12 System Manager
- Chapter 13 Data Communication
- Chapter 14 Geometry
- Chapter 15 Picture Plot
- Chapter 16 3D Graph Function
- Appendix
- Examination Mode
- E-CON4 Application (English)
- 1. E-CON4 Mode Overview
- 2. Sampling Screen
- 3. Auto Sensor Detection (CLAB Only)
- 4. Selecting a Sensor
- 5. Configuring the Sampling Setup
- 6. Performing Auto Sensor Calibration and Zero Adjustment
- 7. Using a Custom Probe
- 8. Using Setup Memory
- 9. Starting a Sampling Operation
- 10. Using Sample Data Memory
- 11. Using the Graph Analysis Tools to Graph Data
- 12. Graph Analysis Tool Graph Screen Operations
- 13. Calling E-CON4 Functions from an eActivity
10-7
• “CALC” will be displayed for the F3 function menu item if the cursor is located in a
calculation line. Pressing 3(CALC) will change the calculation line to a text line.
• If the cursor is located in a strip, use f and c to move to the cursor to a text line.
• On the function menu, selecting {INSERT} and then {TEXT} will insert a new text line
above the line where the cursor is currently located.
2. Input the text or expression you want into the text strip.
• See “Text Line Input and Editing Operations” described below.
u Text Line Input and Editing Operations
• You can input up to 255 bytes of text into a single text line. Text in the text line wraps
automatically to fit inside the display area (Word Wrap Function). Note, however, that
numeric expressions and commands do not wrap.*
1
Scroll arrows ( ]') will appear on the
left and right sides of the calculation line to let you know some of the calculation does not fit
within the calculation line display area. In this case, you can use the left and right cursor keys
to scroll the calculation.
• The 5(A⇔a) function key toggles between upper-case and lower-case input. This function
is available only while alpha text input is enabled. See page 2-8 for details. When upper-case
input is selected,
is displayed in the status bar, and is displayed while lower-case input
is selected.
• Press w to input a carriage return into text. No symbol will be displayed for a carriage
return.
• If the text is wrapped into multiple lines, pressing the A key will delete the line where the
cursor is currently located only. The part of the text that is wrapped to other lines will not be
deleted.
• Always use the Math input/output mode (page
1-15) to input an expression into a text line.
*
1
Also, any word that includes the symbol “ ’ ”, “ { ” or “ ”, which are input using the menu
that appears when you press 4(CHAR), does not wrap.
k Inputting into a Calculation Line
Inputting a calculation expression into an eActivity calculation line and pressing w will display
the calculation result in the following line. Such a calculation line can be used in the same way
as the Run-Matrix
mode (page 1-3). A calculation line and its result make up one set.
• Note that the word wrap function does not apply in the case of math lines. Scroll arrows
( ]') will appear on the left and right sides of the calculation line to let you know some of
the calculation does not fit within the calculation line display area. In this case, you can use
the left and right cursor keys to scroll the calculation.