
User Manual

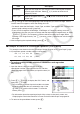


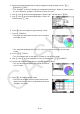


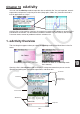
Table Of Contents
- Contents
- Getting Acquainted — Read This First!
- Chapter 1 Basic Operation
- Chapter 2 Manual Calculations
- 1. Basic Calculations
- 2. Special Functions
- 3. Specifying the Angle Unit and Display Format
- 4. Function Calculations
- 5. Numerical Calculations
- 6. Complex Number Calculations
- 7. Binary, Octal, Decimal, and Hexadecimal Calculations with Integers
- 8. Matrix Calculations
- 9. Vector Calculations
- 10. Metric Conversion Calculations
- Chapter 3 List Function
- Chapter 4 Equation Calculations
- Chapter 5 Graphing
- 1. Sample Graphs
- 2. Controlling What Appears on a Graph Screen
- 3. Drawing a Graph
- 4. Saving and Recalling Graph Screen Contents
- 5. Drawing Two Graphs on the Same Screen
- 6. Manual Graphing
- 7. Using Tables
- 8. Modifying a Graph
- 9. Dynamic Graphing
- 10. Graphing a Recursion Formula
- 11. Graphing a Conic Section
- 12. Drawing Dots, Lines, and Text on the Graph Screen (Sketch)
- 13. Function Analysis
- Chapter 6 Statistical Graphs and Calculations
- 1. Before Performing Statistical Calculations
- 2. Calculating and Graphing Single-Variable Statistical Data
- 3. Calculating and Graphing Paired-Variable Statistical Data (Curve Fitting)
- 4. Performing Statistical Calculations
- 5. Tests
- 6. Confidence Interval
- 7. Distribution
- 8. Input and Output Terms of Tests, Confidence Interval, and Distribution
- 9. Statistic Formula
- Chapter 7 Financial Calculation
- Chapter 8 Programming
- Chapter 9 Spreadsheet
- Chapter 10 eActivity
- Chapter 11 Memory Manager
- Chapter 12 System Manager
- Chapter 13 Data Communication
- Chapter 14 Geometry
- Chapter 15 Picture Plot
- Chapter 16 3D Graph Function
- Appendix
- Examination Mode
- E-CON4 Application (English)
- 1. E-CON4 Mode Overview
- 2. Sampling Screen
- 3. Auto Sensor Detection (CLAB Only)
- 4. Selecting a Sensor
- 5. Configuring the Sampling Setup
- 6. Performing Auto Sensor Calibration and Zero Adjustment
- 7. Using a Custom Probe
- 8. Using Setup Memory
- 9. Starting a Sampling Operation
- 10. Using Sample Data Memory
- 11. Using the Graph Analysis Tools to Graph Data
- 12. Graph Analysis Tool Graph Screen Operations
- 13. Calling E-CON4 Functions from an eActivity
9-32
When drawing a pie chart or bar graph, only the Color Link settings (page 6-3) are different
from the settings in the Statistics mode and Spreadsheet mode.
For this
graph
type:
Selecting
this for
Color Link:
Causes this to happen:
Pie Category Of the data being used to draw the graph, the text color of the
cells in the range specified by the StatGraph screen “Category”
setting is reflected in the graph.
Data Of the data being used to draw the graph, the text color of the
cells in the range specified by the StatGraph screen “Data” setting
is reflected in the graph.
Off The text color of the data being used to draw the graph is ignored.
Bar Category Same as the pie chart, above.
Data Of the data being used to draw the graph, the text colors of the
cells in the range specified by the StatGraph screen “Data1”,
“Data2”, and “Data3” settings are reflected in the graph.
Off Same as the pie chart, above.
• When “Pie” is selected as the Graph Type, the “Pie Area” setting is always “Link” whenever
anything other than “Off” is selected for the “Color Link” setting.
• When “Bar” is selected as the Graph Type, the “Data1 Area”, “Data1 Border”, “Data2 Area”,
“Data2 Border”, “Data3 Area”, and “Data3 Border” settings are always “Link” whenever
anything other than “Off” is selected for the “Color Link” setting.
u Graphing examples using Color Link
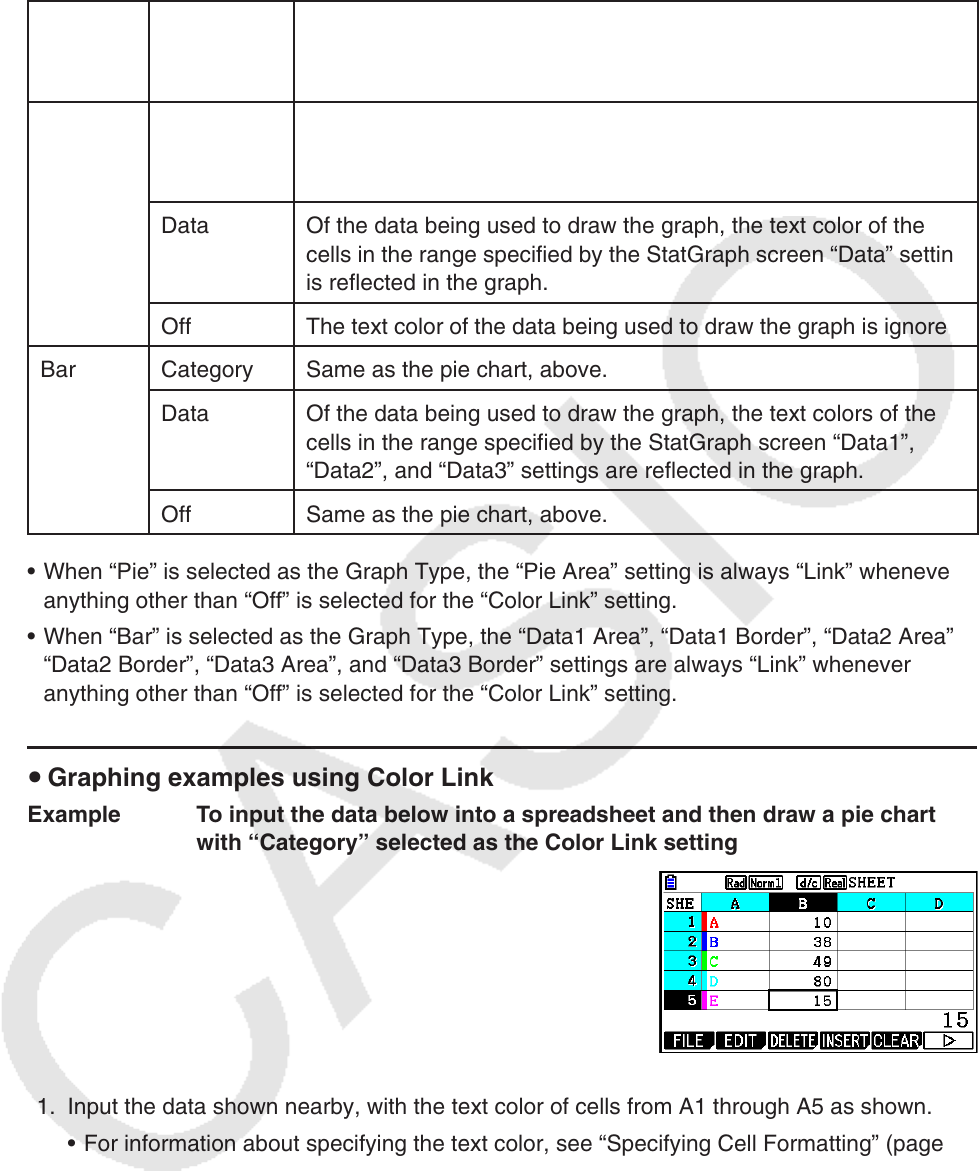
Example To input the data below into a spreadsheet and then draw a pie chart
with “Category” selected as the Color Link setting
1. Input the data shown nearby, with the text color of cells from A1 through A5 as shown.
• For information about specifying the text color, see “Specifying Cell Formatting” (page
9-13).
2. Select the cells in the range A1:B5.
• For information about selecting cells, see “To select a range of cells” (page 9-7).