
User Manual
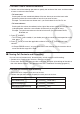
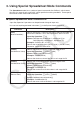
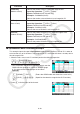
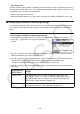
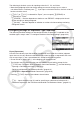
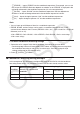
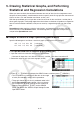
Table Of Contents
- Contents
- Getting Acquainted — Read This First!
- Chapter 1 Basic Operation
- Chapter 2 Manual Calculations
- 1. Basic Calculations
- 2. Special Functions
- 3. Specifying the Angle Unit and Display Format
- 4. Function Calculations
- 5. Numerical Calculations
- 6. Complex Number Calculations
- 7. Binary, Octal, Decimal, and Hexadecimal Calculations with Integers
- 8. Matrix Calculations
- 9. Vector Calculations
- 10. Metric Conversion Calculations
- Chapter 3 List Function
- Chapter 4 Equation Calculations
- Chapter 5 Graphing
- 1. Sample Graphs
- 2. Controlling What Appears on a Graph Screen
- 3. Drawing a Graph
- 4. Saving and Recalling Graph Screen Contents
- 5. Drawing Two Graphs on the Same Screen
- 6. Manual Graphing
- 7. Using Tables
- 8. Modifying a Graph
- 9. Dynamic Graphing
- 10. Graphing a Recursion Formula
- 11. Graphing a Conic Section
- 12. Drawing Dots, Lines, and Text on the Graph Screen (Sketch)
- 13. Function Analysis
- Chapter 6 Statistical Graphs and Calculations
- 1. Before Performing Statistical Calculations
- 2. Calculating and Graphing Single-Variable Statistical Data
- 3. Calculating and Graphing Paired-Variable Statistical Data (Curve Fitting)
- 4. Performing Statistical Calculations
- 5. Tests
- 6. Confidence Interval
- 7. Distribution
- 8. Input and Output Terms of Tests, Confidence Interval, and Distribution
- 9. Statistic Formula
- Chapter 7 Financial Calculation
- Chapter 8 Programming
- Chapter 9 Spreadsheet
- Chapter 10 eActivity
- Chapter 11 Memory Manager
- Chapter 12 System Manager
- Chapter 13 Data Communication
- Chapter 14 Geometry
- Chapter 15 Picture Plot
- Chapter 16 3D Graph Function
- Appendix
- Examination Mode
- E-CON4 Application (English)
- 1. E-CON4 Mode Overview
- 2. Sampling Screen
- 3. Auto Sensor Detection (CLAB Only)
- 4. Selecting a Sensor
- 5. Configuring the Sampling Setup
- 6. Performing Auto Sensor Calibration and Zero Adjustment
- 7. Using a Custom Probe
- 8. Using Setup Memory
- 9. Starting a Sampling Operation
- 10. Using Sample Data Memory
- 11. Using the Graph Analysis Tools to Graph Data
- 12. Graph Analysis Tool Graph Screen Operations
- 13. Calling E-CON4 Functions from an eActivity
9-24
The following is the basic syntax for inputting values for V1, V2, and Value.
• Move the highlighting to the line whose setting you want to change, input a value or
calculation formula, and then press w. If you input a calculation formula, the final value will
be the calculation result.
• If 3(C=) or 4(C≠) is selected for “Expre”, you can specify 2(ERROR) or
3(BLANK) for “Value”.
- 2(ERROR) ... Decision depends on whether or not “ERROR” is displayed in the cell
whose settings are being configured.
- 3(BLANK) ... Decision depends on whether or not the cell whose settings are being
configured is blank.
u Configuring Settings for Expression Type Conditions
The following condition settings can be configured when “Expression” is selected as the
condition type in step 4 under “To configure conditional formatting settings” (page 9-22).
Expre (Expression)
Use this line to directly input the conditional expression to be used for true/false judgment.
Input rules are virtually identical to those that apply when inputting an expression that starts
with an equal sign (=) into a spreadsheet cell, except for the following points.
• Do not include an equal sign (=) at the beginning of the expression.
• The function menu is identical to the one displayed during cell editing, except for the
2(TYPE) item. For details about using other menu items besides 2, see the following.
- “Inputting a Cell Reference Name” (page 9-11)
- “Relative and Absolute Cell Reference Names” (page 9-12)
- “Using Special Spreadsheet Mode Commands” (page 9-19)
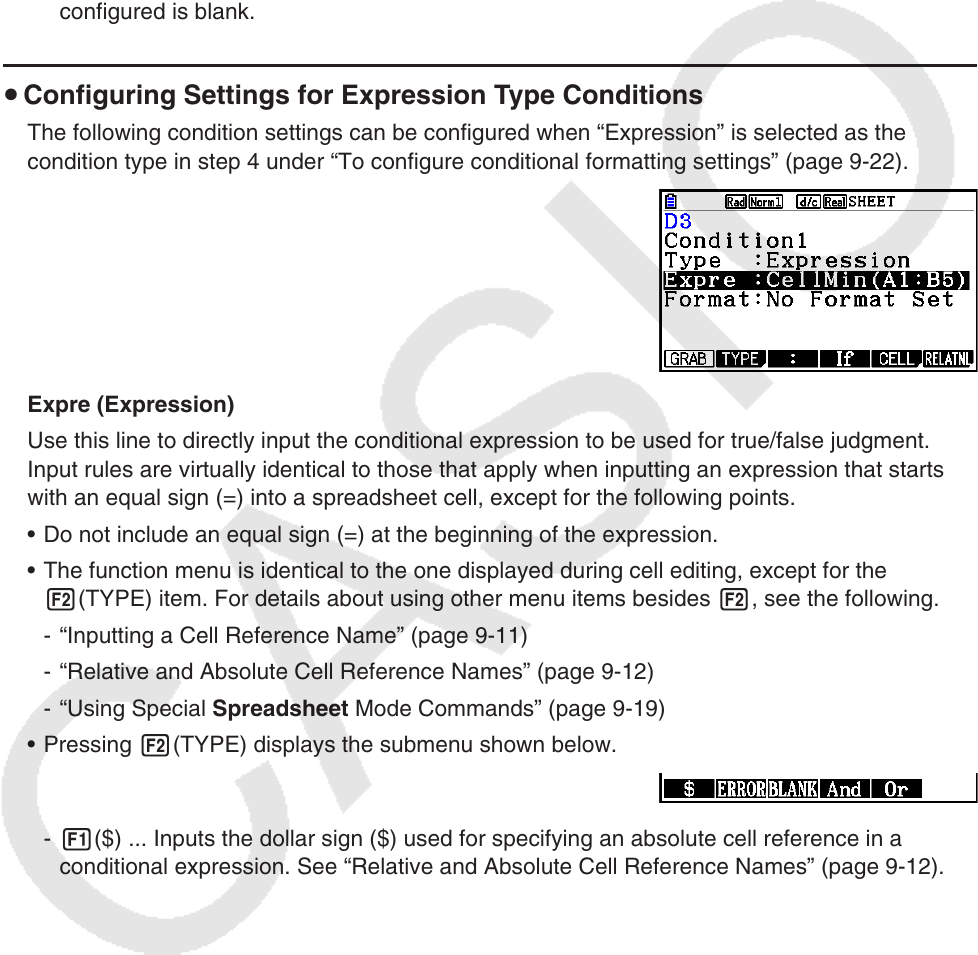
• Pressing 2(TYPE) displays the submenu shown below.
- 1($) ... Inputs the dollar sign ($) used for specifying an absolute cell reference in a
conditional expression. See “Relative and Absolute Cell Reference Names” (page 9-12).