
User Manual
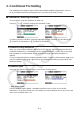
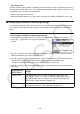
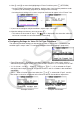
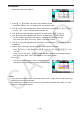
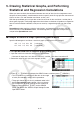
Table Of Contents
- Contents
- Getting Acquainted — Read This First!
- Chapter 1 Basic Operation
- Chapter 2 Manual Calculations
- 1. Basic Calculations
- 2. Special Functions
- 3. Specifying the Angle Unit and Display Format
- 4. Function Calculations
- 5. Numerical Calculations
- 6. Complex Number Calculations
- 7. Binary, Octal, Decimal, and Hexadecimal Calculations with Integers
- 8. Matrix Calculations
- 9. Vector Calculations
- 10. Metric Conversion Calculations
- Chapter 3 List Function
- Chapter 4 Equation Calculations
- Chapter 5 Graphing
- 1. Sample Graphs
- 2. Controlling What Appears on a Graph Screen
- 3. Drawing a Graph
- 4. Saving and Recalling Graph Screen Contents
- 5. Drawing Two Graphs on the Same Screen
- 6. Manual Graphing
- 7. Using Tables
- 8. Modifying a Graph
- 9. Dynamic Graphing
- 10. Graphing a Recursion Formula
- 11. Graphing a Conic Section
- 12. Drawing Dots, Lines, and Text on the Graph Screen (Sketch)
- 13. Function Analysis
- Chapter 6 Statistical Graphs and Calculations
- 1. Before Performing Statistical Calculations
- 2. Calculating and Graphing Single-Variable Statistical Data
- 3. Calculating and Graphing Paired-Variable Statistical Data (Curve Fitting)
- 4. Performing Statistical Calculations
- 5. Tests
- 6. Confidence Interval
- 7. Distribution
- 8. Input and Output Terms of Tests, Confidence Interval, and Distribution
- 9. Statistic Formula
- Chapter 7 Financial Calculation
- Chapter 8 Programming
- Chapter 9 Spreadsheet
- Chapter 10 eActivity
- Chapter 11 Memory Manager
- Chapter 12 System Manager
- Chapter 13 Data Communication
- Chapter 14 Geometry
- Chapter 15 Picture Plot
- Chapter 16 3D Graph Function
- Appendix
- Examination Mode
- E-CON4 Application (English)
- 1. E-CON4 Mode Overview
- 2. Sampling Screen
- 3. Auto Sensor Detection (CLAB Only)
- 4. Selecting a Sensor
- 5. Configuring the Sampling Setup
- 6. Performing Auto Sensor Calibration and Zero Adjustment
- 7. Using a Custom Probe
- 8. Using Setup Memory
- 9. Starting a Sampling Operation
- 10. Using Sample Data Memory
- 11. Using the Graph Analysis Tools to Graph Data
- 12. Graph Analysis Tool Graph Screen Operations
- 13. Calling E-CON4 Functions from an eActivity
9-21
4. Conditional Formatting
The conditional formatting function can be used to define conditional expressions (such as
A1<0) that determine the formatting (text color, area color, paint style) of a cell.
k Conditional Formatting Overview
You can specify up to two conditions for each cell.
Pressing 6(g)5(CONDIT) displays the Condition screen.
To select a particular condition, move the highlighting to the “Condition” line and then press
1(COND1) for Condition1 or 2(COND2) for Condition2.
u Condition Priority Sequence
When you have multiple conditions defined for a cell, they are applied starting from the lower
numbered condition first. If Condition1 is 0≤A1≤10 and Condition2 is 10≤A1≤20, for example,
both conditions are satisfied when A1=10 and the formatting specified by Condition1 is
applied.
If a cell is configured directly using the procedure under “To specify cell formatting” (page 9-13)
and with conditional formatting, application of the conditional formatting is given priority over
the direct settings.
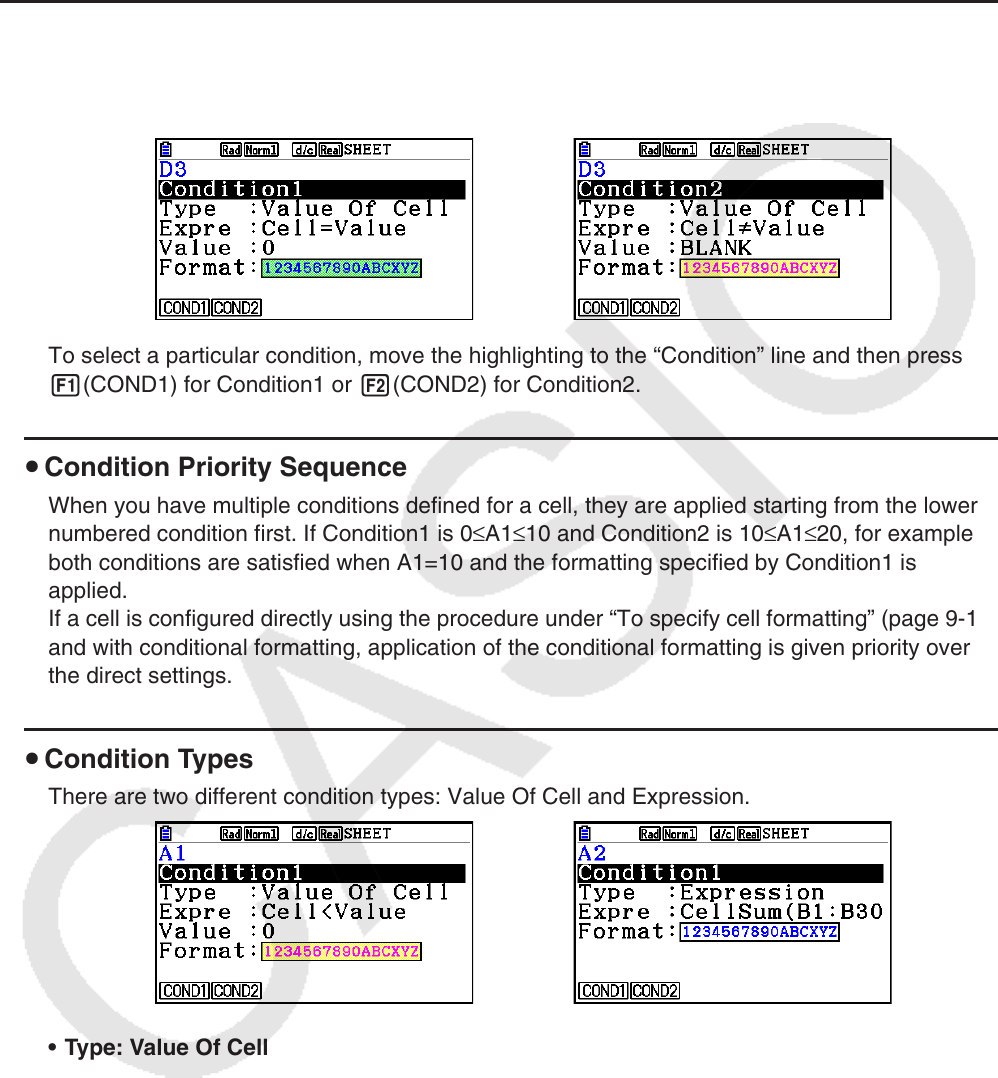
u Condition Types
There are two different condition types: Value Of Cell and Expression.
• Type: Value Of Cell
Use this condition type to define a condition based on a formula (such as A1<0) that
references a value input into the cell. For example you could configure cell A1 so its text is red
when A1<0, and blue when 1<A1.