
User Manual
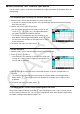
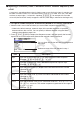
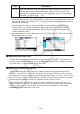
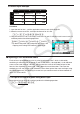

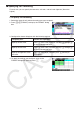
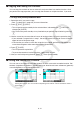
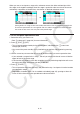
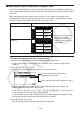
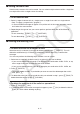
Table Of Contents
- Contents
- Getting Acquainted — Read This First!
- Chapter 1 Basic Operation
- Chapter 2 Manual Calculations
- 1. Basic Calculations
- 2. Special Functions
- 3. Specifying the Angle Unit and Display Format
- 4. Function Calculations
- 5. Numerical Calculations
- 6. Complex Number Calculations
- 7. Binary, Octal, Decimal, and Hexadecimal Calculations with Integers
- 8. Matrix Calculations
- 9. Vector Calculations
- 10. Metric Conversion Calculations
- Chapter 3 List Function
- Chapter 4 Equation Calculations
- Chapter 5 Graphing
- 1. Sample Graphs
- 2. Controlling What Appears on a Graph Screen
- 3. Drawing a Graph
- 4. Saving and Recalling Graph Screen Contents
- 5. Drawing Two Graphs on the Same Screen
- 6. Manual Graphing
- 7. Using Tables
- 8. Modifying a Graph
- 9. Dynamic Graphing
- 10. Graphing a Recursion Formula
- 11. Graphing a Conic Section
- 12. Drawing Dots, Lines, and Text on the Graph Screen (Sketch)
- 13. Function Analysis
- Chapter 6 Statistical Graphs and Calculations
- 1. Before Performing Statistical Calculations
- 2. Calculating and Graphing Single-Variable Statistical Data
- 3. Calculating and Graphing Paired-Variable Statistical Data (Curve Fitting)
- 4. Performing Statistical Calculations
- 5. Tests
- 6. Confidence Interval
- 7. Distribution
- 8. Input and Output Terms of Tests, Confidence Interval, and Distribution
- 9. Statistic Formula
- Chapter 7 Financial Calculation
- Chapter 8 Programming
- Chapter 9 Spreadsheet
- Chapter 10 eActivity
- Chapter 11 Memory Manager
- Chapter 12 System Manager
- Chapter 13 Data Communication
- Chapter 14 Geometry
- Chapter 15 Picture Plot
- Chapter 16 3D Graph Function
- Appendix
- Examination Mode
- E-CON4 Application (English)
- 1. E-CON4 Mode Overview
- 2. Sampling Screen
- 3. Auto Sensor Detection (CLAB Only)
- 4. Selecting a Sensor
- 5. Configuring the Sampling Setup
- 6. Performing Auto Sensor Calibration and Zero Adjustment
- 7. Using a Custom Probe
- 8. Using Setup Memory
- 9. Starting a Sampling Operation
- 10. Using Sample Data Memory
- 11. Using the Graph Analysis Tools to Graph Data
- 12. Graph Analysis Tool Graph Screen Operations
- 13. Calling E-CON4 Functions from an eActivity
9-16
k Inputting the Same Formula into a Range of Cells
Use the Fill command when you want to input the same formula into a specified range of cells.
The rules governing relative and absolute cell name references are the same as those for copy
and paste.
When you need to input the same formula into cells B1, B2, and B3, for example, the Fill
command lets you do so by inputting the formula once, into cell B1. Note the following about
how the Fill command handles cell name references in this case.
When cell B1 contains this: The Fill command will do this:
=A1 × 2
A B
1
=A1 × 2
2
=A2 × 2
3
=A3 × 2
* Note that in actual practice
cells B1, B2, and B3
will show the calculation
results, not the formulas as
shown here.
=$A$2 × 2
A B
1
=$A$2 × 2
2
=$A$2 × 2
3
=$A$2 × 2
u To input the same formula into a range of cells
1. Select the range of cells into which you want to input the same formula.
• In this example we will assume the B1:B3 is selected. See “To select a range of cells”
(page 9-7).
2. Press 2(EDIT) 6( g) 1(FILL).
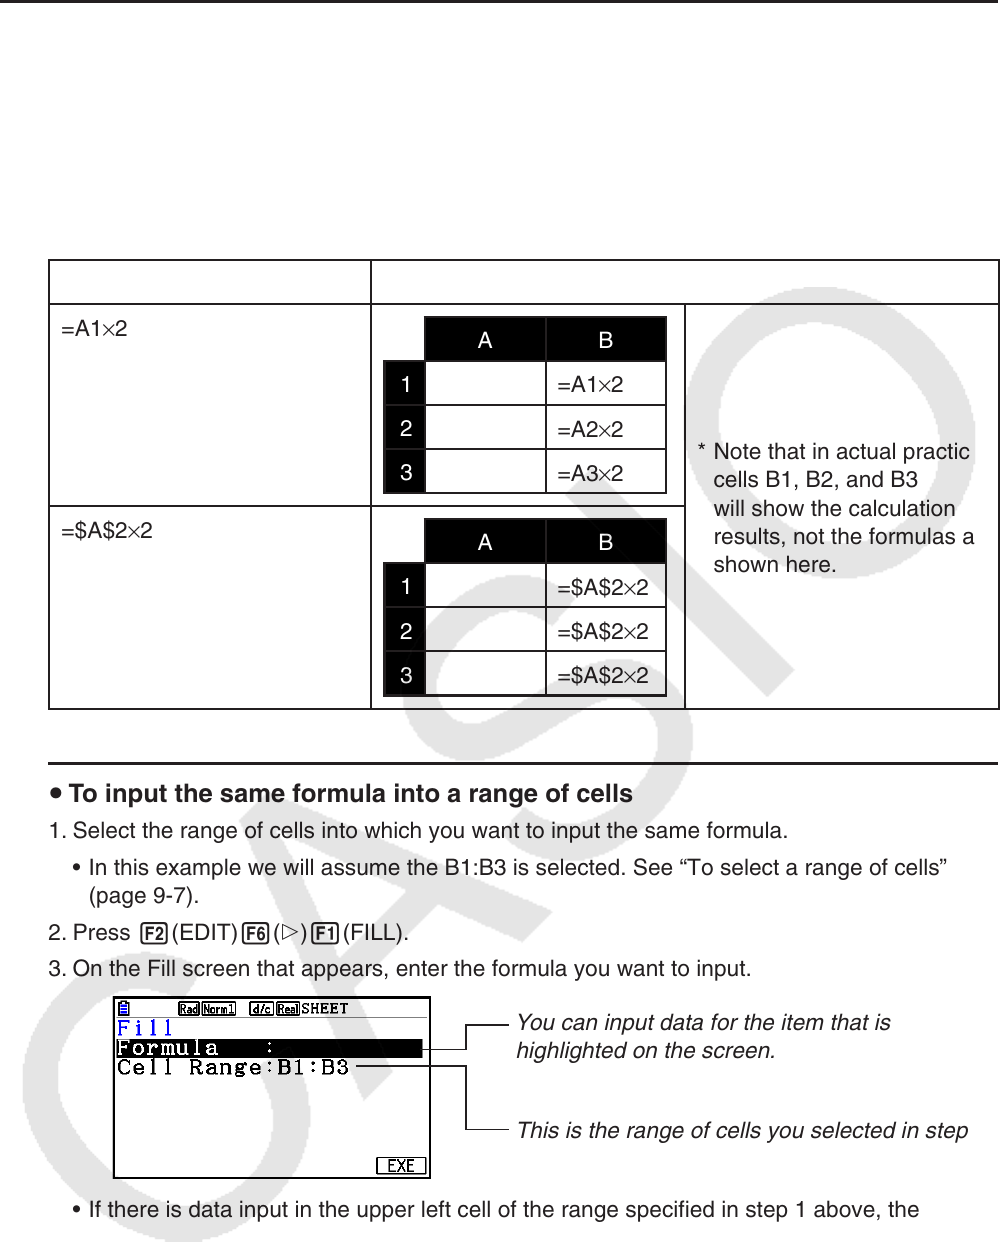
3. On the Fill screen that appears, enter the formula you want to input.
You can input data for the item that is
highlighted on the screen.
This is the range of cells you selected in step 1.
• If there is data input in the upper left cell of the range specified in step 1 above, the
formula will be displayed in the “Formula” line.
• In the “Formula” line, input =A1 × 2 ( !.(=) av(A) b*cw). Pressing w will
cause the cell cursor to move to the “Cell Range” line.
• If any cell within the cell range already contains data, performing the next step will cause
the existing data to be overwritten with the new fill data (formula).
4. Press 6(EXE) or the w key.
• This will input the formula into the range of cells you specified.