
User Manual
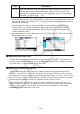

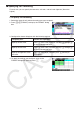
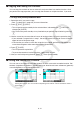
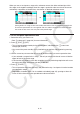
Table Of Contents
- Contents
- Getting Acquainted — Read This First!
- Chapter 1 Basic Operation
- Chapter 2 Manual Calculations
- 1. Basic Calculations
- 2. Special Functions
- 3. Specifying the Angle Unit and Display Format
- 4. Function Calculations
- 5. Numerical Calculations
- 6. Complex Number Calculations
- 7. Binary, Octal, Decimal, and Hexadecimal Calculations with Integers
- 8. Matrix Calculations
- 9. Vector Calculations
- 10. Metric Conversion Calculations
- Chapter 3 List Function
- Chapter 4 Equation Calculations
- Chapter 5 Graphing
- 1. Sample Graphs
- 2. Controlling What Appears on a Graph Screen
- 3. Drawing a Graph
- 4. Saving and Recalling Graph Screen Contents
- 5. Drawing Two Graphs on the Same Screen
- 6. Manual Graphing
- 7. Using Tables
- 8. Modifying a Graph
- 9. Dynamic Graphing
- 10. Graphing a Recursion Formula
- 11. Graphing a Conic Section
- 12. Drawing Dots, Lines, and Text on the Graph Screen (Sketch)
- 13. Function Analysis
- Chapter 6 Statistical Graphs and Calculations
- 1. Before Performing Statistical Calculations
- 2. Calculating and Graphing Single-Variable Statistical Data
- 3. Calculating and Graphing Paired-Variable Statistical Data (Curve Fitting)
- 4. Performing Statistical Calculations
- 5. Tests
- 6. Confidence Interval
- 7. Distribution
- 8. Input and Output Terms of Tests, Confidence Interval, and Distribution
- 9. Statistic Formula
- Chapter 7 Financial Calculation
- Chapter 8 Programming
- Chapter 9 Spreadsheet
- Chapter 10 eActivity
- Chapter 11 Memory Manager
- Chapter 12 System Manager
- Chapter 13 Data Communication
- Chapter 14 Geometry
- Chapter 15 Picture Plot
- Chapter 16 3D Graph Function
- Appendix
- Examination Mode
- E-CON4 Application (English)
- 1. E-CON4 Mode Overview
- 2. Sampling Screen
- 3. Auto Sensor Detection (CLAB Only)
- 4. Selecting a Sensor
- 5. Configuring the Sampling Setup
- 6. Performing Auto Sensor Calibration and Zero Adjustment
- 7. Using a Custom Probe
- 8. Using Setup Memory
- 9. Starting a Sampling Operation
- 10. Using Sample Data Memory
- 11. Using the Graph Analysis Tools to Graph Data
- 12. Graph Analysis Tool Graph Screen Operations
- 13. Calling E-CON4 Functions from an eActivity
9-8
k Data (Constants, Text, Formula) Input Basics
First let’s have a look at a few basic procedures that apply regardless of the type of data you
are inputting.
u To overwrite data currently in a cell with new data
1. Move the cell cursor to the cell where you want to input data.
• If the cell you select already contains data, the following step will overwrite the existing
data with new input.
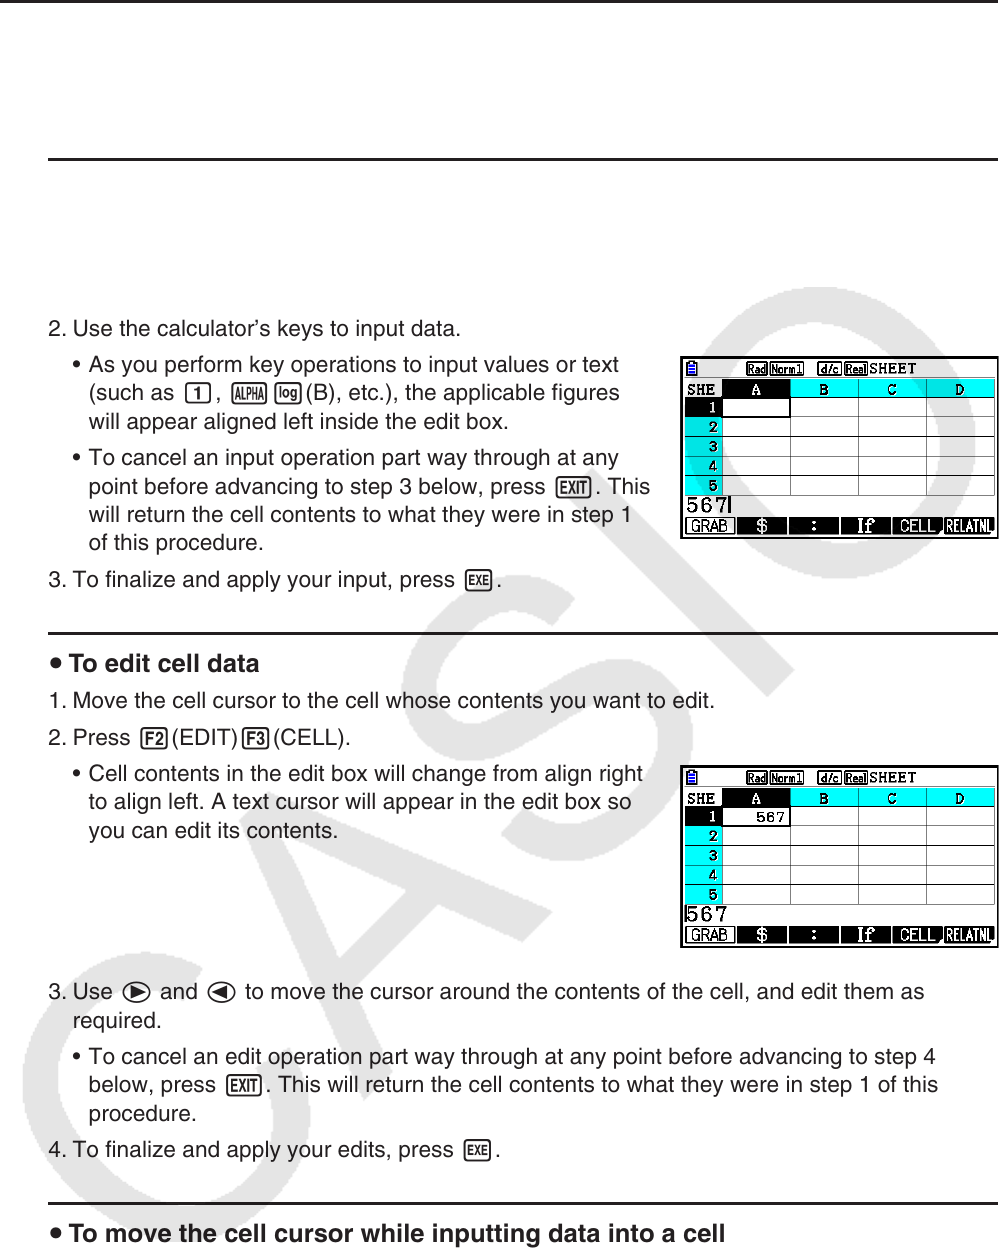
2. Use the calculator’s keys to input data.
• As you perform key operations to input values or text
(such as b, al(B), etc.), the applicable figures
will appear aligned left inside the edit box.
• To cancel an input operation part way through at any
point before advancing to step 3 below, press J. This
will return the cell contents to what they were in step 1
of this procedure.
3. To finalize and apply your input, press w.
u To edit cell data
1. Move the cell cursor to the cell whose contents you want to edit.
2. Press 2(EDIT) 3(CELL).
• Cell contents in the edit box will change from align right
to align left. A text cursor will appear in the edit box so
you can edit its contents.
3. Use e and d to move the cursor around the contents of the cell, and edit them as
required.
• To cancel an edit operation part way through at any point before advancing to step 4
below, press J. This will return the cell contents to what they were in step 1 of this
procedure.
4. To finalize and apply your edits, press w.
u To move the cell cursor while inputting data into a cell
Under factory default settings, pressing w while inputting data into a cell will cause the cell
cursor to move to the next line. You can specify movement to the next column instead using
the “Move” setting as described on page 1-38.