
User Manual

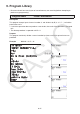
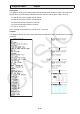
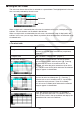
Table Of Contents
- Contents
- Getting Acquainted — Read This First!
- Chapter 1 Basic Operation
- Chapter 2 Manual Calculations
- 1. Basic Calculations
- 2. Special Functions
- 3. Specifying the Angle Unit and Display Format
- 4. Function Calculations
- 5. Numerical Calculations
- 6. Complex Number Calculations
- 7. Binary, Octal, Decimal, and Hexadecimal Calculations with Integers
- 8. Matrix Calculations
- 9. Vector Calculations
- 10. Metric Conversion Calculations
- Chapter 3 List Function
- Chapter 4 Equation Calculations
- Chapter 5 Graphing
- 1. Sample Graphs
- 2. Controlling What Appears on a Graph Screen
- 3. Drawing a Graph
- 4. Saving and Recalling Graph Screen Contents
- 5. Drawing Two Graphs on the Same Screen
- 6. Manual Graphing
- 7. Using Tables
- 8. Modifying a Graph
- 9. Dynamic Graphing
- 10. Graphing a Recursion Formula
- 11. Graphing a Conic Section
- 12. Drawing Dots, Lines, and Text on the Graph Screen (Sketch)
- 13. Function Analysis
- Chapter 6 Statistical Graphs and Calculations
- 1. Before Performing Statistical Calculations
- 2. Calculating and Graphing Single-Variable Statistical Data
- 3. Calculating and Graphing Paired-Variable Statistical Data (Curve Fitting)
- 4. Performing Statistical Calculations
- 5. Tests
- 6. Confidence Interval
- 7. Distribution
- 8. Input and Output Terms of Tests, Confidence Interval, and Distribution
- 9. Statistic Formula
- Chapter 7 Financial Calculation
- Chapter 8 Programming
- Chapter 9 Spreadsheet
- Chapter 10 eActivity
- Chapter 11 Memory Manager
- Chapter 12 System Manager
- Chapter 13 Data Communication
- Chapter 14 Geometry
- Chapter 15 Picture Plot
- Chapter 16 3D Graph Function
- Appendix
- Examination Mode
- E-CON4 Application (English)
- 1. E-CON4 Mode Overview
- 2. Sampling Screen
- 3. Auto Sensor Detection (CLAB Only)
- 4. Selecting a Sensor
- 5. Configuring the Sampling Setup
- 6. Performing Auto Sensor Calibration and Zero Adjustment
- 7. Using a Custom Probe
- 8. Using Setup Memory
- 9. Starting a Sampling Operation
- 10. Using Sample Data Memory
- 11. Using the Graph Analysis Tools to Graph Data
- 12. Graph Analysis Tool Graph Screen Operations
- 13. Calling E-CON4 Functions from an eActivity
9-7
u Using the JUMP Command to Move the Cell Cursor
To move the cell cursor to here: Do this:
A particular cell
1. Press 2(EDIT) 4(JUMP) 1(GO).
2. On the dialog box that appears, enter the name
of the cell (A1 to Z999) to which you want to
jump.
3. Press w.
Line 1 of the current column
Press 2(EDIT) 4(JUMP) 2(TOP ↑ ).
Column A of the current row
Press 2(EDIT) 4(JUMP) 3(TOP ← ).
Last line of the current column
Press 2(EDIT) 4(JUMP) 4(BTM ↓ ).
Column Z of the current row
Press 2(EDIT) 4(JUMP) 5(BTM → ).
u To select a range of cells
1. Move the cell cursor to the start point of the range of cells you want to select.
• You could select and entire row or column of cells as the start point, if you want. For details
about selecting cells, see “To select cells” on page 9-6.
2. Press !i(CLIP).
• This will change the cell cursor to a thick-line boundary instead of the normal highlighting.
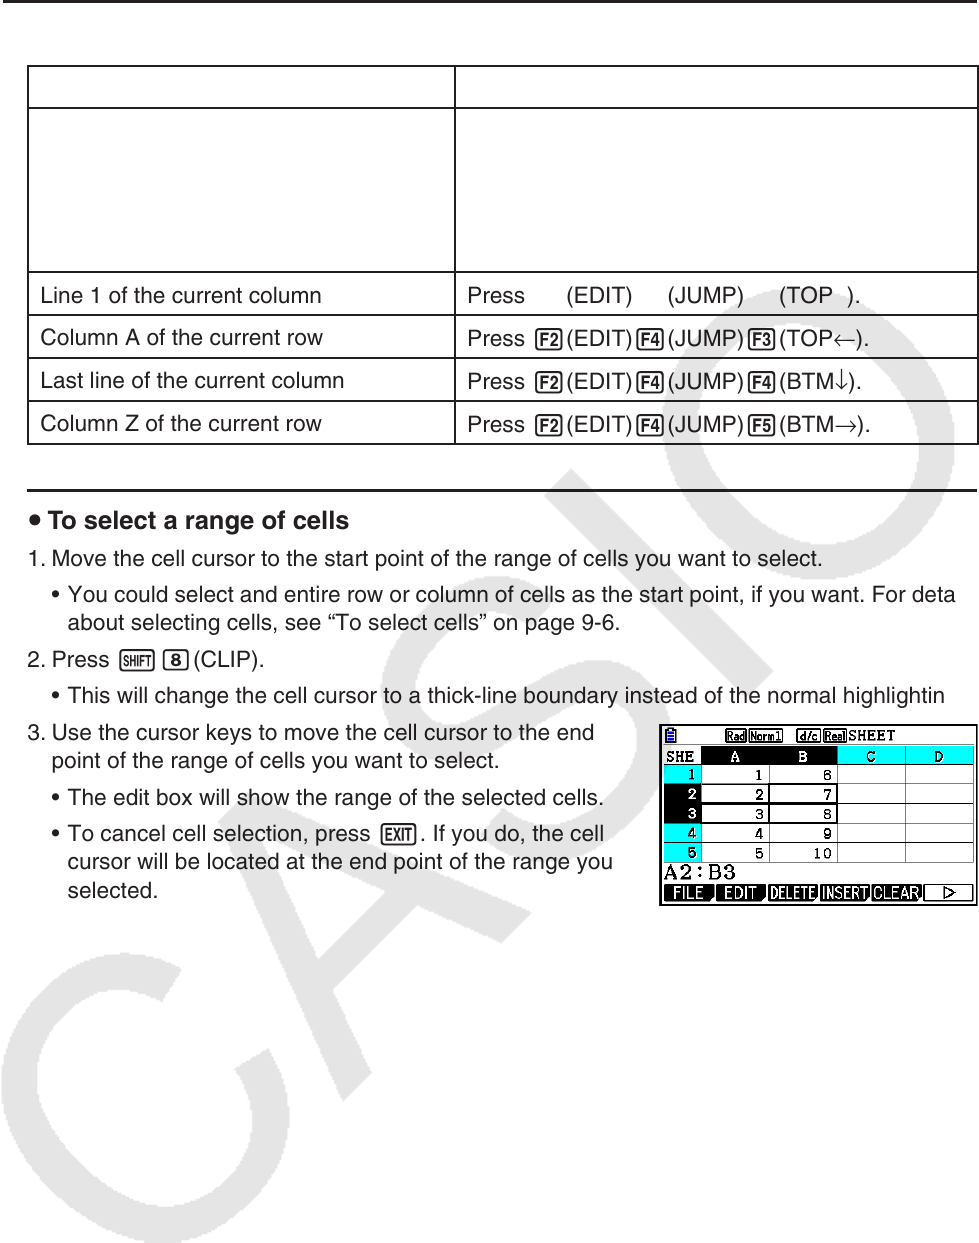
3. Use the cursor keys to move the cell cursor to the end
point of the range of cells you want to select.
• The edit box will show the range of the selected cells.
• To cancel cell selection, press J. If you do, the cell
cursor will be located at the end point of the range you
selected.