User Manual
Table Of Contents
- Contents
- Getting Acquainted — Read This First!
- Chapter 1 Basic Operation
- Chapter 2 Manual Calculations
- 1. Basic Calculations
- 2. Special Functions
- 3. Specifying the Angle Unit and Display Format
- 4. Function Calculations
- 5. Numerical Calculations
- 6. Complex Number Calculations
- 7. Binary, Octal, Decimal, and Hexadecimal Calculations with Integers
- 8. Matrix Calculations
- 9. Vector Calculations
- 10. Metric Conversion Calculations
- Chapter 3 List Function
- Chapter 4 Equation Calculations
- Chapter 5 Graphing
- 1. Sample Graphs
- 2. Controlling What Appears on a Graph Screen
- 3. Drawing a Graph
- 4. Saving and Recalling Graph Screen Contents
- 5. Drawing Two Graphs on the Same Screen
- 6. Manual Graphing
- 7. Using Tables
- 8. Modifying a Graph
- 9. Dynamic Graphing
- 10. Graphing a Recursion Formula
- 11. Graphing a Conic Section
- 12. Drawing Dots, Lines, and Text on the Graph Screen (Sketch)
- 13. Function Analysis
- Chapter 6 Statistical Graphs and Calculations
- 1. Before Performing Statistical Calculations
- 2. Calculating and Graphing Single-Variable Statistical Data
- 3. Calculating and Graphing Paired-Variable Statistical Data (Curve Fitting)
- 4. Performing Statistical Calculations
- 5. Tests
- 6. Confidence Interval
- 7. Distribution
- 8. Input and Output Terms of Tests, Confidence Interval, and Distribution
- 9. Statistic Formula
- Chapter 7 Financial Calculation
- Chapter 8 Programming
- Chapter 9 Spreadsheet
- Chapter 10 eActivity
- Chapter 11 Memory Manager
- Chapter 12 System Manager
- Chapter 13 Data Communication
- Chapter 14 Geometry
- Chapter 15 Picture Plot
- Chapter 16 3D Graph Function
- Appendix
- Examination Mode
- E-CON4 Application (English)
- 1. E-CON4 Mode Overview
- 2. Sampling Screen
- 3. Auto Sensor Detection (CLAB Only)
- 4. Selecting a Sensor
- 5. Configuring the Sampling Setup
- 6. Performing Auto Sensor Calibration and Zero Adjustment
- 7. Using a Custom Probe
- 8. Using Setup Memory
- 9. Starting a Sampling Operation
- 10. Using Sample Data Memory
- 11. Using the Graph Analysis Tools to Graph Data
- 12. Graph Analysis Tool Graph Screen Operations
- 13. Calling E-CON4 Functions from an eActivity

8-61
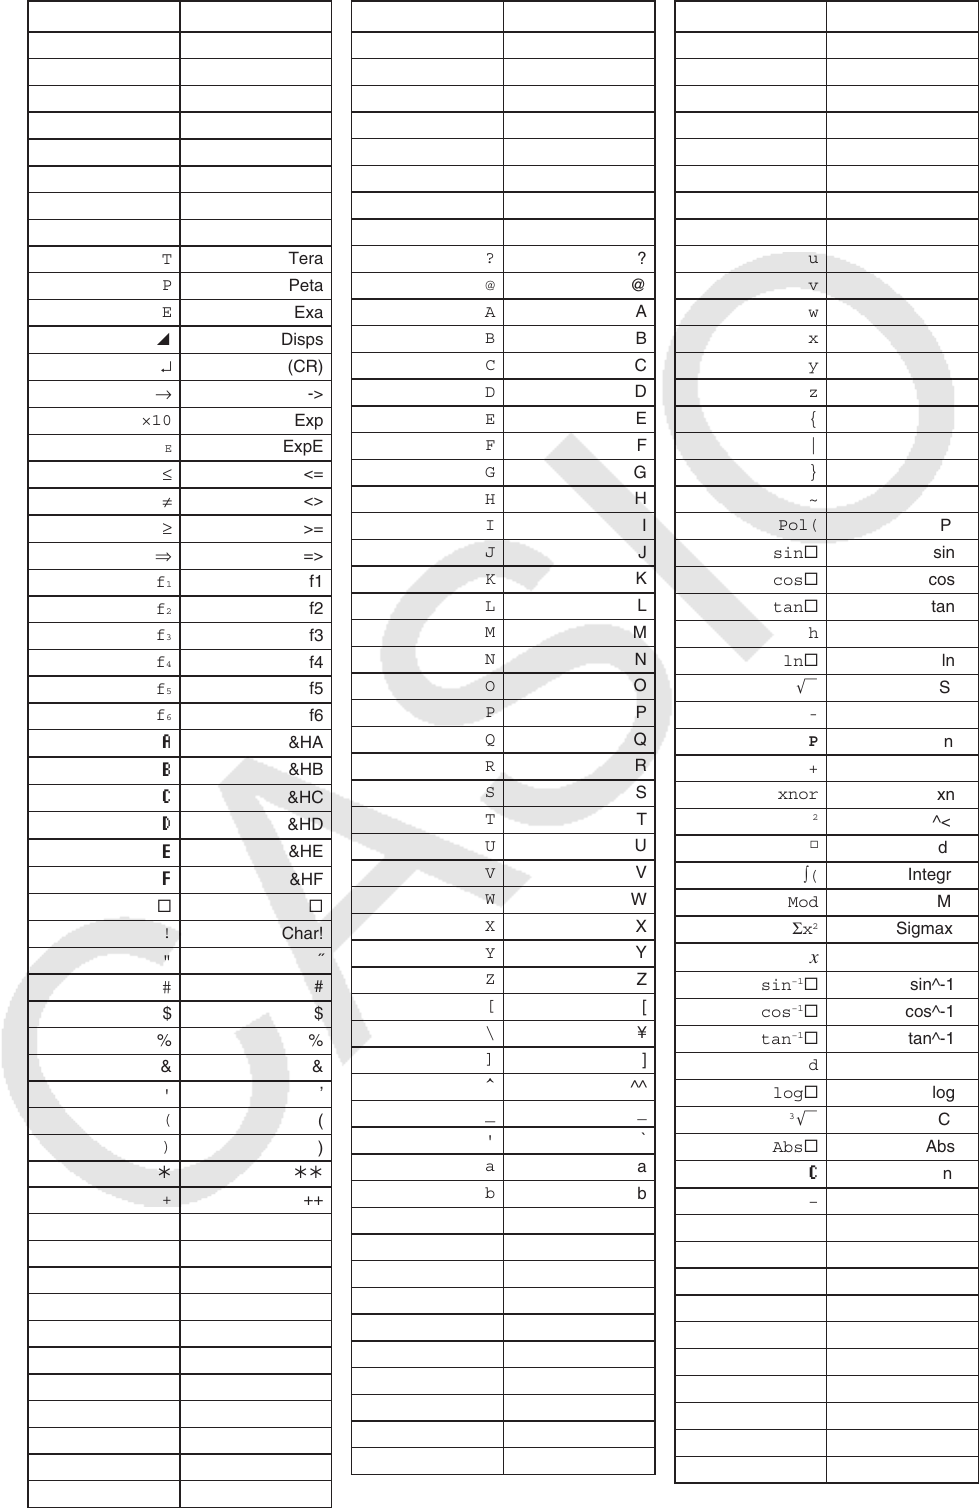
Command Text
f
femto
p
pico
n
nano
μ
micro
m
milli
k
kilo
M
Mega
G
Giga
T
Tera
P
Peta
E
Exa
^
Disps
↵
(CR)
→
->
×10
Exp
E
ExpE
≤
<=
≠
<>
≥
>=
⇒
=>
f
1
f1
f
2
f2
f
3
f3
f
4
f4
f
5
f5
f
6
f6
a
&HA
b
&HB
c
&HC
d
&HD
e
&HE
f
&HF
®®
!
Char!
"
˝
#
#
$$
%%
&&
'
’
(
(
)
)
€€€
+
++
, ,
-
Char-
.
.
/
//
0
0
1
1
2
2
3
3
4
4
5
5
6
6
Command Text
7
7
8
8
9
9
:
:
; ;
<
<
=
=
>
>
?
?
@
@
A
A
B
B
C
C
D
D
E
E
F
F
G
G
H
H
I
I
J
J
K
K
L
L
M
M
N
N
O
O
P
P
Q
Q
R
R
S
S
T
T
U
U
V
V
W
W
X
X
Y
Y
Z
Z
[
[
\
¥
]
]
^
^^
_
_
'
`
a
a
b
b
c
c
d
d
e
e
f
f
g
g
h
h
i
i
j
j
k
k
l
l
Command Text
m
m
n
n
o
o
p
p
q
q
r
r
s
s
t
t
u
u
v
v
w
w
x
x
y
y
z
z
{
{
|
|
}
}
~
˜
Pol(
Pol(
sin® sin®
cos® cos®
tan® tan®
h
&h
ln® ln®
'
Sqrt
-
(-)
P
nPr
+
+
xnor
xnor
2
^<2>
®
dms
∫(
Integral(
Mod
Mod
Σx
2
Sigmax^2
x
X
sin
−1
® sin^-1®
cos
−1
® cos^-1®
tan
−1
® tan^-1®
d
&d
log® log®
3
'
Cbrt
Abs® Abs®
c
nCr
−
−
xor
xor
−1
^<-1>
°
deg
Med
Med
Σx
Sigmax
Rec(
Rec(
sinh® sinh®
cosh® cosh®
tanh® tanh®
o
&o
* “®” in the following tables indicates a space.


