
User Manual
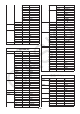


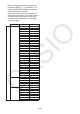
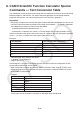
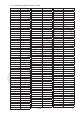


Table Of Contents
- Contents
- Getting Acquainted — Read This First!
- Chapter 1 Basic Operation
- Chapter 2 Manual Calculations
- 1. Basic Calculations
- 2. Special Functions
- 3. Specifying the Angle Unit and Display Format
- 4. Function Calculations
- 5. Numerical Calculations
- 6. Complex Number Calculations
- 7. Binary, Octal, Decimal, and Hexadecimal Calculations with Integers
- 8. Matrix Calculations
- 9. Vector Calculations
- 10. Metric Conversion Calculations
- Chapter 3 List Function
- Chapter 4 Equation Calculations
- Chapter 5 Graphing
- 1. Sample Graphs
- 2. Controlling What Appears on a Graph Screen
- 3. Drawing a Graph
- 4. Saving and Recalling Graph Screen Contents
- 5. Drawing Two Graphs on the Same Screen
- 6. Manual Graphing
- 7. Using Tables
- 8. Modifying a Graph
- 9. Dynamic Graphing
- 10. Graphing a Recursion Formula
- 11. Graphing a Conic Section
- 12. Drawing Dots, Lines, and Text on the Graph Screen (Sketch)
- 13. Function Analysis
- Chapter 6 Statistical Graphs and Calculations
- 1. Before Performing Statistical Calculations
- 2. Calculating and Graphing Single-Variable Statistical Data
- 3. Calculating and Graphing Paired-Variable Statistical Data (Curve Fitting)
- 4. Performing Statistical Calculations
- 5. Tests
- 6. Confidence Interval
- 7. Distribution
- 8. Input and Output Terms of Tests, Confidence Interval, and Distribution
- 9. Statistic Formula
- Chapter 7 Financial Calculation
- Chapter 8 Programming
- Chapter 9 Spreadsheet
- Chapter 10 eActivity
- Chapter 11 Memory Manager
- Chapter 12 System Manager
- Chapter 13 Data Communication
- Chapter 14 Geometry
- Chapter 15 Picture Plot
- Chapter 16 3D Graph Function
- Appendix
- Examination Mode
- E-CON4 Application (English)
- 1. E-CON4 Mode Overview
- 2. Sampling Screen
- 3. Auto Sensor Detection (CLAB Only)
- 4. Selecting a Sensor
- 5. Configuring the Sampling Setup
- 6. Performing Auto Sensor Calibration and Zero Adjustment
- 7. Using a Custom Probe
- 8. Using Setup Memory
- 9. Starting a Sampling Operation
- 10. Using Sample Data Memory
- 11. Using the Graph Analysis Tools to Graph Data
- 12. Graph Analysis Tool Graph Screen Operations
- 13. Calling E-CON4 Functions from an eActivity
8-58
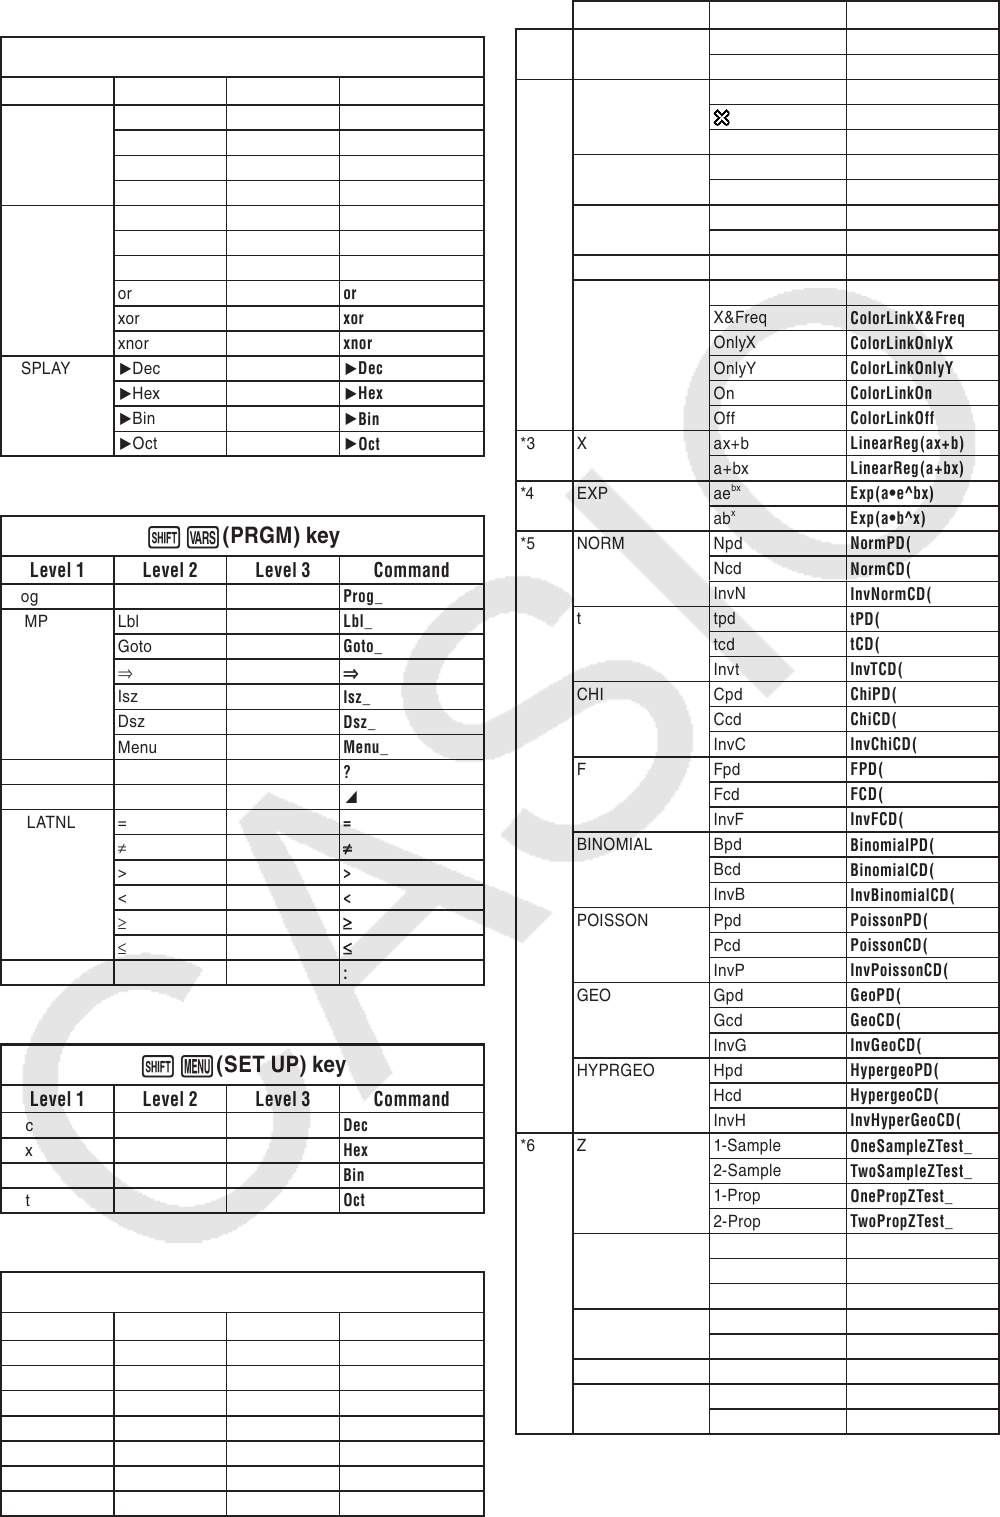
BASE Program
4
(MENU) key
Level 1Level 2Level 3 Command
d~o d
d
h
h
b
b
o
o
LOGIC Neg
Neg_
Not
Not_
and
and
or
or
xor
xor
xnor
xnor
DISPLAY
'
Dec
'
Dec
'
Hex
'
Hex
'
Bin
'
Bin
'
Oct
'
Oct
!J
(PRGM) key
Level 1Level 2Level 3 Command
Prog
Prog_
JUMP Lbl
Lbl_
Goto
Goto_
⇒⇒
⇒
Isz
Isz_
Dsz
Dsz_
Menu
Menu_
?
?
^^
RELATNL =
=
≠≠
≠
>
>
<
<
≥≥
≥
≤≤
≤
:
:
!m
(SET UP) key
Level 1 Level 2 Level 3 Command
Dec
Dec
Hex
Hex
Bin
Bin
Oct
Oct
!
f
(FORMAT) key
Level 1Level 2Level 3 Command
1:Black
Black_
2:Blue
Blue_
3:Red
Red_
4:Magenta
Magenta_
5:Green
Green_
6:Cyan
Cyan_
7:Yellow
Yellow_
Level 3 Level 4 Command
*1 Exp ae
bx
Exp(ae^bx)
ab
x
Exp(ab^x)
*2 MARK
Square
Cross
Dot
STICK Length
StickLength
Horz
StickHoriz
%DATA %
%
Data
Data
None
None
COLOR LINK BothXY
ColorLinkX&Y
X&Freq
ColorLinkX&Freq
OnlyX
ColorLinkOnlyX
OnlyY
ColorLinkOnlyY
On
ColorLinkOn
Off
ColorLinkOff
*3 X ax+b
LinearReg(ax+b)
a+bx
LinearReg(a+bx)
*4 EXP ae
bx
Exp(a•e^bx)
ab
x
Exp(a•b^x)
*5 NORM Npd
NormPD(
Ncd
NormCD(
InvN
InvNormCD(
ttpd
tPD(
tcd
tCD(
Invt
InvTCD(
CHI Cpd
ChiPD(
Ccd
ChiCD(
InvC
InvChiCD(
FFpd
FPD(
Fcd
FCD(
InvF
InvFCD(
BINOMIAL Bpd
BinomialPD(
Bcd
BinomialCD(
InvB
InvBinomialCD(
POISSON Ppd
PoissonPD(
Pcd
PoissonCD(
InvP
InvPoissonCD(
GEO Gpd
GeoPD(
Gcd
GeoCD(
InvG
InvGeoCD(
HYPRGEO Hpd
HypergeoPD(
Hcd
HypergeoCD(
InvH
InvHyperGeoCD(
*6 Z 1-Sample
OneSampleZTest_
2-Sample
TwoSampleZTest_
1-Prop
OnePropZTest_
2-Prop
TwoPropZTest_
t1-Sample
OneSampleTTest_
2-Sample
TwoSampleTTest_
REG
LinRegTTest_
CHI GOF
ChiGOFTest_
2WAY
ChiTest_
F
TwoSampleFTest_
ANOVA 1WAYANO
OneWayANOVA_
2WAYANO
TwoWayANOVA_