
User Manual
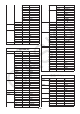


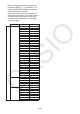
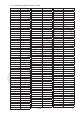


Table Of Contents
- Contents
- Getting Acquainted — Read This First!
- Chapter 1 Basic Operation
- Chapter 2 Manual Calculations
- 1. Basic Calculations
- 2. Special Functions
- 3. Specifying the Angle Unit and Display Format
- 4. Function Calculations
- 5. Numerical Calculations
- 6. Complex Number Calculations
- 7. Binary, Octal, Decimal, and Hexadecimal Calculations with Integers
- 8. Matrix Calculations
- 9. Vector Calculations
- 10. Metric Conversion Calculations
- Chapter 3 List Function
- Chapter 4 Equation Calculations
- Chapter 5 Graphing
- 1. Sample Graphs
- 2. Controlling What Appears on a Graph Screen
- 3. Drawing a Graph
- 4. Saving and Recalling Graph Screen Contents
- 5. Drawing Two Graphs on the Same Screen
- 6. Manual Graphing
- 7. Using Tables
- 8. Modifying a Graph
- 9. Dynamic Graphing
- 10. Graphing a Recursion Formula
- 11. Graphing a Conic Section
- 12. Drawing Dots, Lines, and Text on the Graph Screen (Sketch)
- 13. Function Analysis
- Chapter 6 Statistical Graphs and Calculations
- 1. Before Performing Statistical Calculations
- 2. Calculating and Graphing Single-Variable Statistical Data
- 3. Calculating and Graphing Paired-Variable Statistical Data (Curve Fitting)
- 4. Performing Statistical Calculations
- 5. Tests
- 6. Confidence Interval
- 7. Distribution
- 8. Input and Output Terms of Tests, Confidence Interval, and Distribution
- 9. Statistic Formula
- Chapter 7 Financial Calculation
- Chapter 8 Programming
- Chapter 9 Spreadsheet
- Chapter 10 eActivity
- Chapter 11 Memory Manager
- Chapter 12 System Manager
- Chapter 13 Data Communication
- Chapter 14 Geometry
- Chapter 15 Picture Plot
- Chapter 16 3D Graph Function
- Appendix
- Examination Mode
- E-CON4 Application (English)
- 1. E-CON4 Mode Overview
- 2. Sampling Screen
- 3. Auto Sensor Detection (CLAB Only)
- 4. Selecting a Sensor
- 5. Configuring the Sampling Setup
- 6. Performing Auto Sensor Calibration and Zero Adjustment
- 7. Using a Custom Probe
- 8. Using Setup Memory
- 9. Starting a Sampling Operation
- 10. Using Sample Data Memory
- 11. Using the Graph Analysis Tools to Graph Data
- 12. Graph Analysis Tool Graph Screen Operations
- 13. Calling E-CON4 Functions from an eActivity
8-57
ENG On
EngOn
Off
EngOff
Eng
Eng
SKT/LIN —
S-L-Normal
—
S-L-Thick
·····
S-L-Broken
······
S-L-Dot
—
S-L-Thin
DRAW Connect
G-Connect
Plot
G-Plot
DERIV On
DerivOn
Off
DerivOff
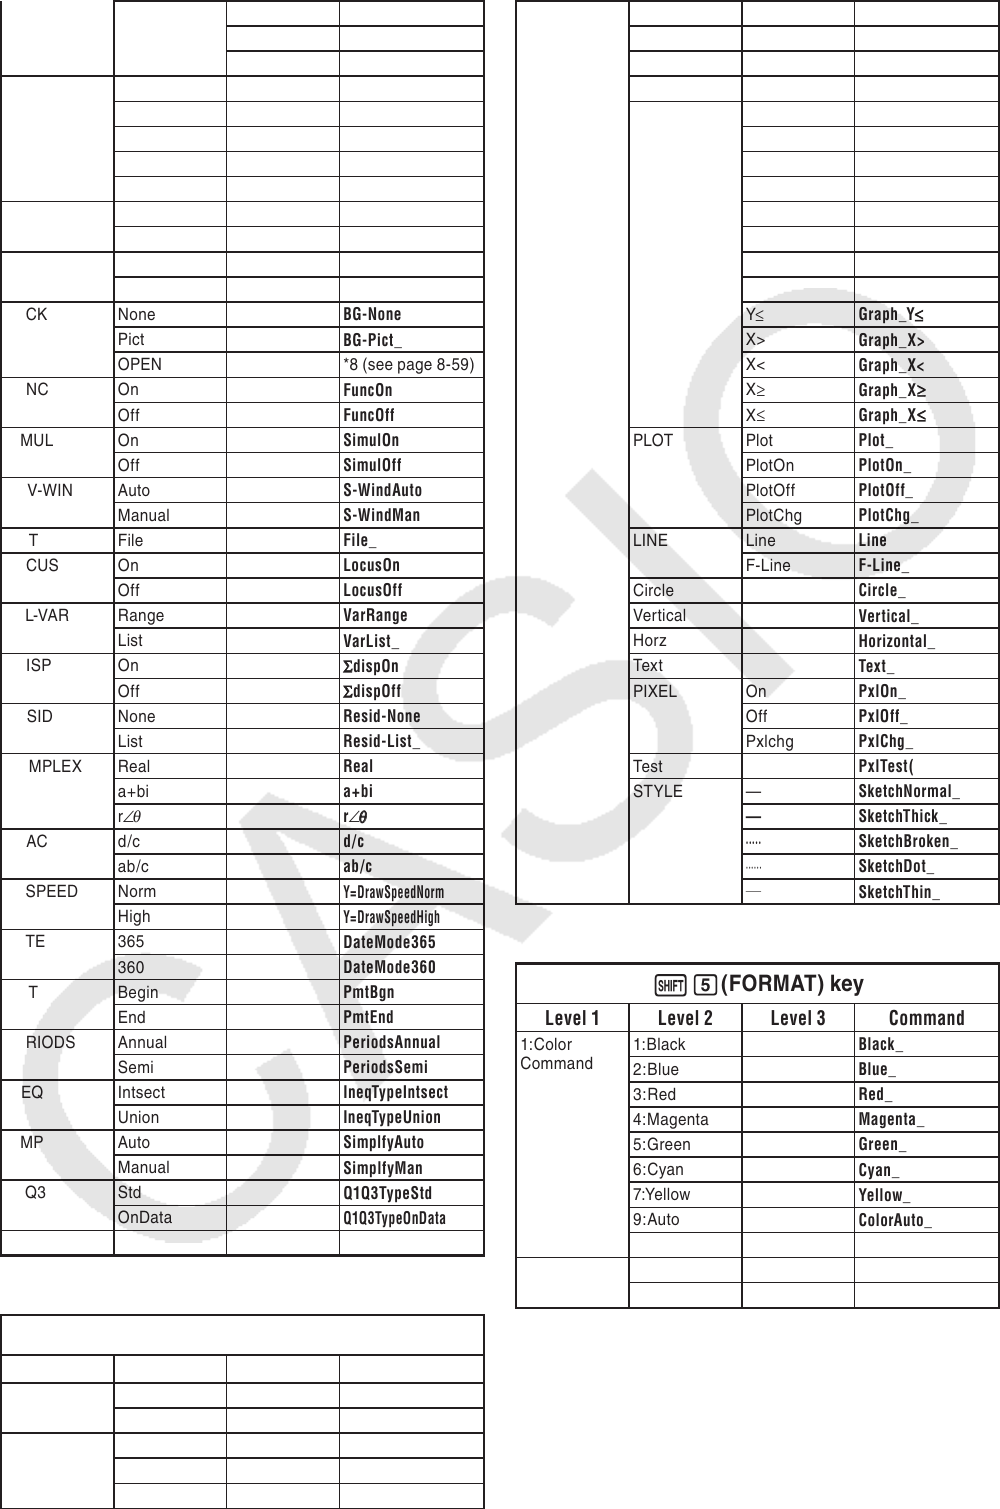
BACK None
BG-None
Pict
BG-Pict_
OPEN *8 (see page 8-59)
FUNC On
FuncOn
Off
FuncOff
SIMUL On
SimulOn
Off
SimulOff
SGV-WIN Auto
S-WindAuto
Manual
S-WindMan
LIST File
File_
LOCUS On
LocusOn
Off
LocusOff
TBL-VAR Range
VarRange
List
VarList_
Σ
DISP On
Σ
Σ
dispOn
Off
Σ
dispOff
RESID None
Resid-None
List
Resid-List_
COMPLEX Real
Real
a+bi
a+bi
r
∠
θ
r
∠
θ
θ
FRAC d/c
d/c
ab/c
ab/c
Y=SPEED Norm
Y=DrawSpeedNorm
High
Y=DrawSpeedHigh
DATE 365
DateMode365
360
DateMode360
PMT Begin
PmtBgn
End
PmtEnd
PERIODS Annual
PeriodsAnnual
Semi
PeriodsSemi
INEQ Intsect
IneqTypeIntsect
Union
IneqTypeUnion
SIMP Auto
SimplfyAuto
Manual
SimplfyMan
Q1Q3 Std
Q1Q3TypeStd
OnData
Q1Q3TypeOnData
P/L-CLR
Plot/Line-Color_
!
key
Level 1Level 2Level 3 Command
ZOOM Factor
Factor_
Auto
ZoomAuto
V-WIN V-Win
ViewWindow_
Store
StoV-Win_
Recall
RclV-Win_
SKETCH Cls
Cls
Tangent
Tangent_
Norm
Normal_
Inverse
Inverse_
GRAPH Y=
Graph_Y=
r=
Graph_r=
Param
Graph(X,Y)=(
x=c
Graph_X=
G·
∫
dX
Graph_
∫
∫
Y>
Graph_Y>
Y<
Graph_Y<
Y
≥
Graph_Y
≥
Y
≤
Graph_Y
≤
X>
Graph_X>
X<
Graph_X<
X
≥
Graph_X
≥
X
≤
Graph_X
≤
≤
PLOT Plot
Plot_
PlotOn
PlotOn_
PlotOff
PlotOff_
PlotChg
PlotChg_
LINE Line
Line
F-Line
F-Line_
Circle
Circle_
Vertical
Vertical_
Horz
Horizontal_
Text
Text_
PIXEL On
PxlOn_
Off
PxlOff_
Pxlchg
PxlChg_
Test
PxlTest(
STYLE —
SketchNormal_
—
SketchThick_
·····
SketchBroken_
······
SketchDot_
—
SketchThin_
!
f
(FORMAT) key
Level 1Level 2Level 3 Command
1:Color 1:Black
Black_
Command
2:Blue
Blue_
3:Red
Red_
4:Magenta
Magenta_
5:Green
Green_
6:Cyan
Cyan_
7:Yellow
Yellow_
9:Auto
ColorAuto_
A:Clear
ColorClr_
2:Paint 1:Normal
ColorNormal_
Command
2:Lighter
ColorLighter_