
User Manual
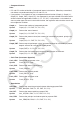
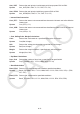
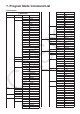
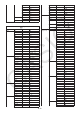
Table Of Contents
- Contents
- Getting Acquainted — Read This First!
- Chapter 1 Basic Operation
- Chapter 2 Manual Calculations
- 1. Basic Calculations
- 2. Special Functions
- 3. Specifying the Angle Unit and Display Format
- 4. Function Calculations
- 5. Numerical Calculations
- 6. Complex Number Calculations
- 7. Binary, Octal, Decimal, and Hexadecimal Calculations with Integers
- 8. Matrix Calculations
- 9. Vector Calculations
- 10. Metric Conversion Calculations
- Chapter 3 List Function
- Chapter 4 Equation Calculations
- Chapter 5 Graphing
- 1. Sample Graphs
- 2. Controlling What Appears on a Graph Screen
- 3. Drawing a Graph
- 4. Saving and Recalling Graph Screen Contents
- 5. Drawing Two Graphs on the Same Screen
- 6. Manual Graphing
- 7. Using Tables
- 8. Modifying a Graph
- 9. Dynamic Graphing
- 10. Graphing a Recursion Formula
- 11. Graphing a Conic Section
- 12. Drawing Dots, Lines, and Text on the Graph Screen (Sketch)
- 13. Function Analysis
- Chapter 6 Statistical Graphs and Calculations
- 1. Before Performing Statistical Calculations
- 2. Calculating and Graphing Single-Variable Statistical Data
- 3. Calculating and Graphing Paired-Variable Statistical Data (Curve Fitting)
- 4. Performing Statistical Calculations
- 5. Tests
- 6. Confidence Interval
- 7. Distribution
- 8. Input and Output Terms of Tests, Confidence Interval, and Distribution
- 9. Statistic Formula
- Chapter 7 Financial Calculation
- Chapter 8 Programming
- Chapter 9 Spreadsheet
- Chapter 10 eActivity
- Chapter 11 Memory Manager
- Chapter 12 System Manager
- Chapter 13 Data Communication
- Chapter 14 Geometry
- Chapter 15 Picture Plot
- Chapter 16 3D Graph Function
- Appendix
- Examination Mode
- E-CON4 Application (English)
- 1. E-CON4 Mode Overview
- 2. Sampling Screen
- 3. Auto Sensor Detection (CLAB Only)
- 4. Selecting a Sensor
- 5. Configuring the Sampling Setup
- 6. Performing Auto Sensor Calibration and Zero Adjustment
- 7. Using a Custom Probe
- 8. Using Setup Memory
- 9. Starting a Sampling Operation
- 10. Using Sample Data Memory
- 11. Using the Graph Analysis Tools to Graph Data
- 12. Graph Analysis Tool Graph Screen Operations
- 13. Calling E-CON4 Functions from an eActivity
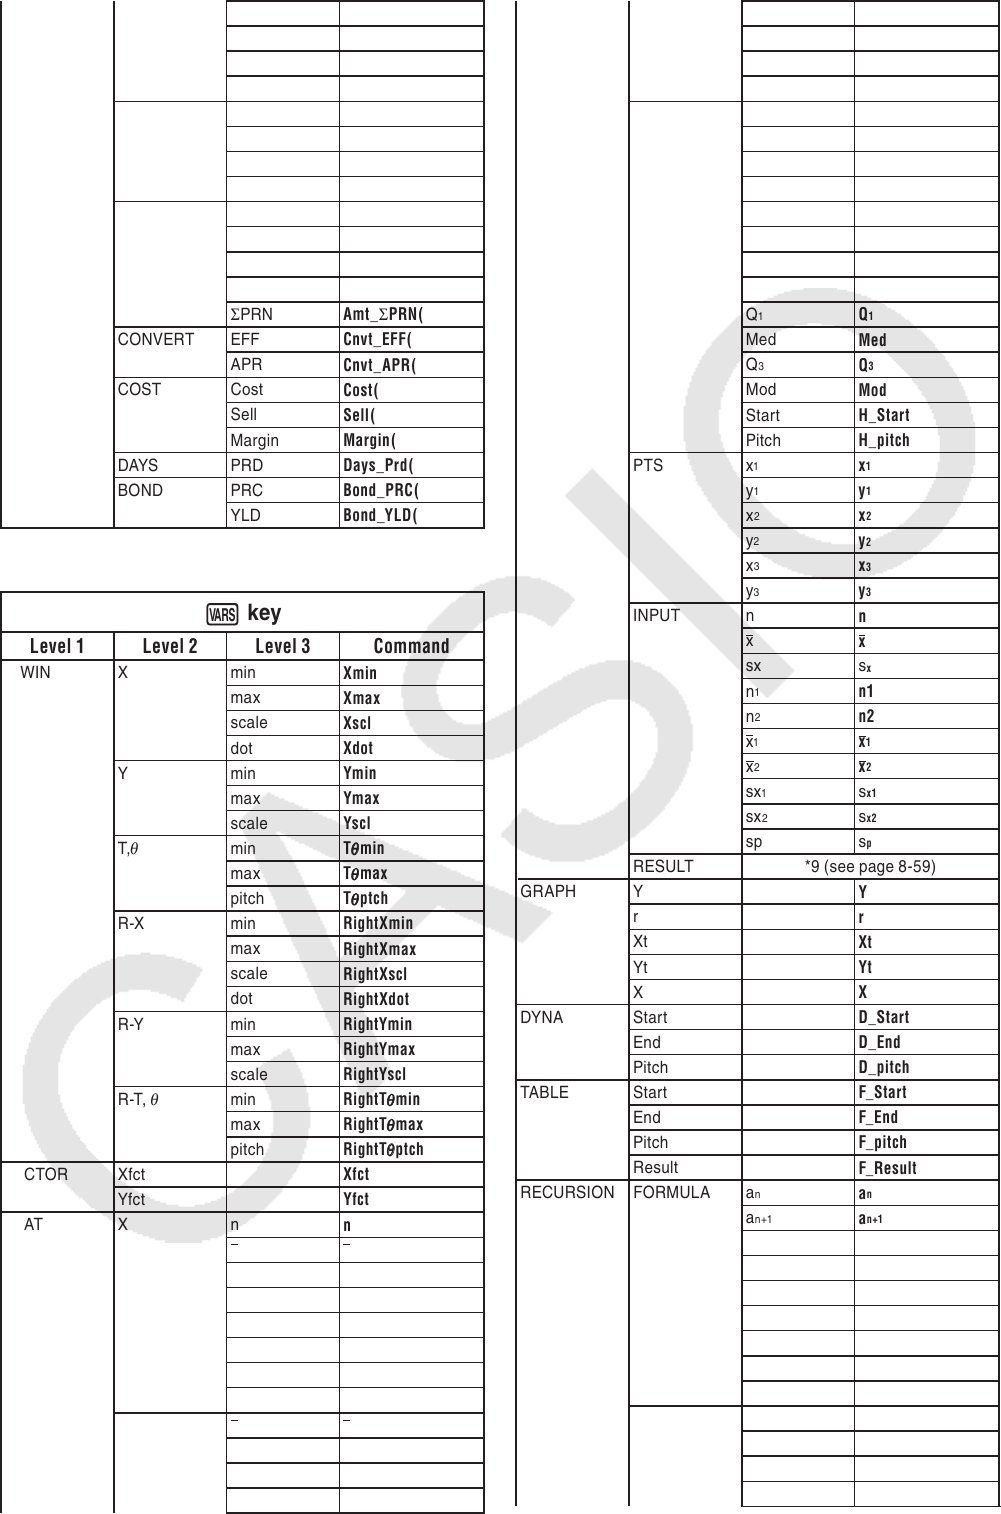
8-55
I%
Cmpd_I%(
PV
Cmpd_PV(
PMT
Cmpd_PMT(
FV
Cmpd_FV(
CASH NPV
Cash_NPV(
IRR
Cash_IRR(
PBP
Cash_PBP(
NFV
Cash_NFV(
AMORTZN BAL
Amt_BAL(
INT
Amt_INT(
PRN
Amt_PRN(
Σ
INT
Amt_
Σ
INT(
Σ
PRN
Amt_
Σ
PRN(
CONVERT EFF
Cnvt_EFF(
APR
Cnvt_APR(
COST Cost
Cost(
Sell
Sell(
Margin
Margin(
DAYS PRD
Days_Prd(
BOND PRC
Bond_PRC(
YLD
Bond_YLD(
J
key
Level 1Level 2Level 3 Command
V-WIN X min
Xmin
max
Xmax
scale
Xscl
dot
Xdot
Ymin
Ymin
max
Ymax
scale
Yscl
T,
θ
min
T
θ
θ
min
max
T
θ
max
pitch
T
θ
ptch
R-X min
RightXmin
max
RightXmax
scale
RightXscl
dot
RightXdot
R-Y min
RightYmin
max
RightYmax
scale
RightYscl
R-T,
θ
min
RightT
θ
min
max
RightT
θ
max
pitch
RightT
θ
θ
ptch
FACTOR Xfct
Xfct
Yfct
Yfct
STAT X n
n
x
x
Σ
x
Σ
x
Σ
x
2
Σ
x
2
σ
x
σ
x
sx
s
x
minX
minX
maxX
maxX
Yy
y
Σ
y
Σ
y
Σ
y
2
Σ
y
2
Σ
xy
Σ
Σ
xy
σ
y
σ
σ
y
sy
s
y
minY
minY
maxY
maxY
GRAPH a
a
b
b
c
c
d
d
e
e
r
r
r
2
r
2
MSe
MSe
Q
1
Q
1
Med
Med
Q
3
Q
3
Mod
Mod
Start
H_Start
Pitch
H_pitch
PTS x
1
x
1
y
1
y
1
x
2
x
2
y
2
y
2
x
3
x
3
y
3
y
3
INPUT n
n
x
x
sx s
x
n
1
n1
n
2
n2
x
1
x
1
x
2
x
2
sx
1
s
x1
sx
2
s
x2
sp s
p
RESULT *9 (see page 8-59)
GRAPH Y
Y
r
r
Xt
Xt
Yt
Yt
X
X
DYNA Start
D_Start
End
D_End
Pitch
D_pitch
TABLE Start
F_Start
End
F_End
Pitch
F_pitch
Result
F_Result
RECURSION FORMULA a
n
a
n
a
n+1
a
n+1
a
n+2
a
n+2
b
n
b
n
b
n+1
b
n+1
b
n+2
b
n+2
c
n
c
n
c
n+1
c
n+1
c
n+2
c
n+2
RANGE Start
R_Start
End
R_End
a
0
a
0
a
1
a
1