
User Manual
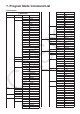
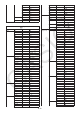
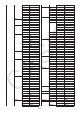
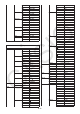
Table Of Contents
- Contents
- Getting Acquainted — Read This First!
- Chapter 1 Basic Operation
- Chapter 2 Manual Calculations
- 1. Basic Calculations
- 2. Special Functions
- 3. Specifying the Angle Unit and Display Format
- 4. Function Calculations
- 5. Numerical Calculations
- 6. Complex Number Calculations
- 7. Binary, Octal, Decimal, and Hexadecimal Calculations with Integers
- 8. Matrix Calculations
- 9. Vector Calculations
- 10. Metric Conversion Calculations
- Chapter 3 List Function
- Chapter 4 Equation Calculations
- Chapter 5 Graphing
- 1. Sample Graphs
- 2. Controlling What Appears on a Graph Screen
- 3. Drawing a Graph
- 4. Saving and Recalling Graph Screen Contents
- 5. Drawing Two Graphs on the Same Screen
- 6. Manual Graphing
- 7. Using Tables
- 8. Modifying a Graph
- 9. Dynamic Graphing
- 10. Graphing a Recursion Formula
- 11. Graphing a Conic Section
- 12. Drawing Dots, Lines, and Text on the Graph Screen (Sketch)
- 13. Function Analysis
- Chapter 6 Statistical Graphs and Calculations
- 1. Before Performing Statistical Calculations
- 2. Calculating and Graphing Single-Variable Statistical Data
- 3. Calculating and Graphing Paired-Variable Statistical Data (Curve Fitting)
- 4. Performing Statistical Calculations
- 5. Tests
- 6. Confidence Interval
- 7. Distribution
- 8. Input and Output Terms of Tests, Confidence Interval, and Distribution
- 9. Statistic Formula
- Chapter 7 Financial Calculation
- Chapter 8 Programming
- Chapter 9 Spreadsheet
- Chapter 10 eActivity
- Chapter 11 Memory Manager
- Chapter 12 System Manager
- Chapter 13 Data Communication
- Chapter 14 Geometry
- Chapter 15 Picture Plot
- Chapter 16 3D Graph Function
- Appendix
- Examination Mode
- E-CON4 Application (English)
- 1. E-CON4 Mode Overview
- 2. Sampling Screen
- 3. Auto Sensor Detection (CLAB Only)
- 4. Selecting a Sensor
- 5. Configuring the Sampling Setup
- 6. Performing Auto Sensor Calibration and Zero Adjustment
- 7. Using a Custom Probe
- 8. Using Setup Memory
- 9. Starting a Sampling Operation
- 10. Using Sample Data Memory
- 11. Using the Graph Analysis Tools to Graph Data
- 12. Graph Analysis Tool Graph Screen Operations
- 13. Calling E-CON4 Functions from an eActivity
8-53
Σ
a
n+2
Σ
Σ
a
n+2
Σ
b
n
Σ
b
n
Σ
b
n+1
Σ
b
n+1
Σ
b
n+2
Σ
b
n+2
Σ
c
n
Σ
c
n
Σ
c
n+1
Σ
c
n+1
Σ
c
n+2
Σ
c
n+2
RANGE a
0
Sel_a
0
a
1
Sel_a
1
GRHCLR
SetG-Color_
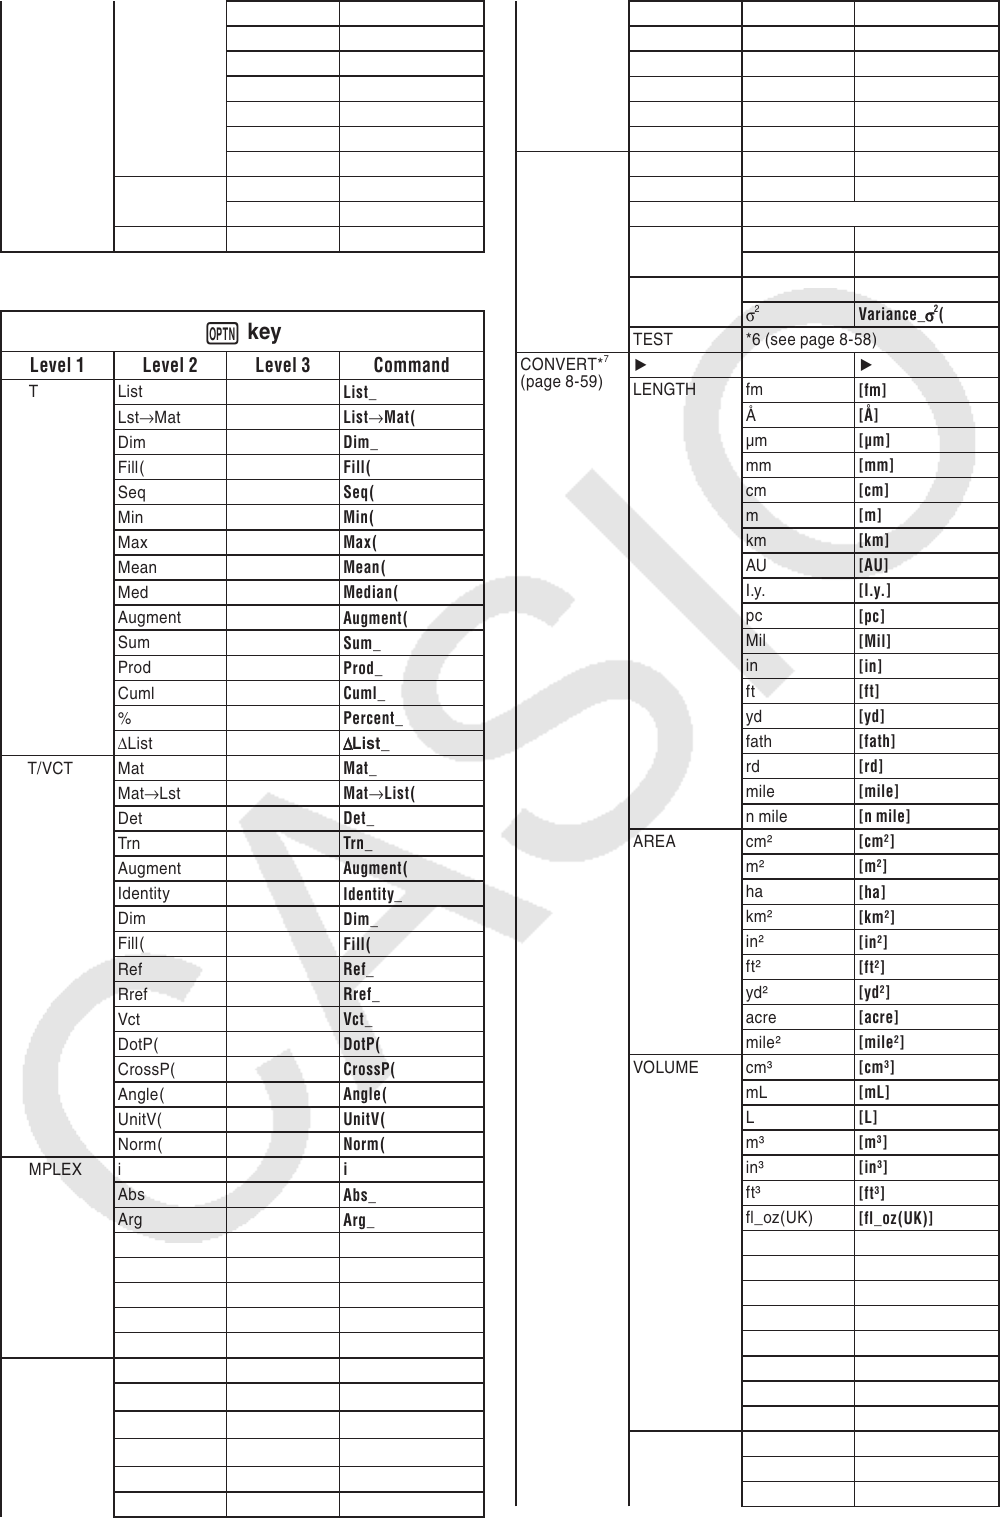
K
key
Level 1Level 2Level 3 Command
LIST List
List_
Lst
→
Mat
List
→
Mat(
Dim
Dim_
Fill(
Fill(
Seq
Seq(
Min
Min(
Max
Max(
Mean
Mean(
Med
Median(
Augment
Augment(
Sum
Sum_
Prod
Prod_
Cuml
Cuml_
%
Percent_
Δ
List
Δ
Δ
List_
MAT/VCT Mat
Mat_
Mat
→
Lst
Mat
→
List(
Det
Det_
Trn
Trn_
Augment
Augment(
Identity
Identity_
Dim
Dim_
Fill(
Fill(
Ref
Ref_
Rref
Rref_
Vct
Vct_
DotP(
DotP(
CrossP(
CrossP(
Angle(
Angle(
UnitV(
UnitV(
Norm(
Norm(
COMPLEX i
i
Abs
Abs_
Arg
Arg_
Conjg
Conjg_
ReP
ReP_
ImP
ImP_
'
r
∠
θ
'
r
∠
θ
'
a+bi
'
a+bi
CALC Solve
Solve(
d/d
x
d/dx(
d
2
/d
x
2
d
2
/dx
2
(
∫
d
x
∫
(
SolveN
SolveN(
FMin
FMin(
FMax
FMax(
Σ
(
Σ
Σ
(
log
a
b
log
a
b(
Int÷
_Int÷_
Rmdr
_Rmdr_
Simp
'
Simp_
STAT xˆ xˆ
yˆ yˆ
DIST *5 (see page 8-58)
StdDev s
StdDev(
σ
StdDev_
σ
(
Var s
2
Variance(
σ
2
Variance_
σ
2
(
TEST *6 (see page 8-58)
CONVERT*
7
(page 8-59)
''
LENGTH fm
[fm]
Å
[Å]
μm
[μm]
mm
[mm]
cm
[cm]
m
[m]
km
[km]
AU
[AU]
I.y.
[I.y.]
pc
[pc]
Mil
[Mil]
in
[in]
ft
[ft]
yd
[yd]
fath
[fath]
rd
[rd]
mile
[mile]
n mile
[n mile]
AREA cm²
[cm²]
m²
[m²]
ha
[ha]
km²
[km²]
in²
[in²]
ft²
[ft²]
yd²
[yd²]
acre
[acre]
mile²
[mile²]
VOLUME cm³
[cm³]
mL
[mL]
L
[L]
m³
[m³]
in³
[in³]
ft³
[ft³]
fl_oz(UK)
[fl_oz(UK)]
fl_oz(US)
[fl_oz(US)]
gal(US)
[gal(US)]
gal(UK)
[gal(UK)]
pt
[pt]
qt
[qt]
tsp
[tsp]
tbsp
[tbsp]
cup
[cup]
TIME ns
[ns]
μs
[μs]
ms
[ms]