
User Manual
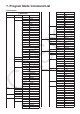
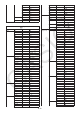
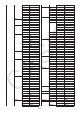
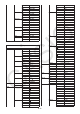
Table Of Contents
- Contents
- Getting Acquainted — Read This First!
- Chapter 1 Basic Operation
- Chapter 2 Manual Calculations
- 1. Basic Calculations
- 2. Special Functions
- 3. Specifying the Angle Unit and Display Format
- 4. Function Calculations
- 5. Numerical Calculations
- 6. Complex Number Calculations
- 7. Binary, Octal, Decimal, and Hexadecimal Calculations with Integers
- 8. Matrix Calculations
- 9. Vector Calculations
- 10. Metric Conversion Calculations
- Chapter 3 List Function
- Chapter 4 Equation Calculations
- Chapter 5 Graphing
- 1. Sample Graphs
- 2. Controlling What Appears on a Graph Screen
- 3. Drawing a Graph
- 4. Saving and Recalling Graph Screen Contents
- 5. Drawing Two Graphs on the Same Screen
- 6. Manual Graphing
- 7. Using Tables
- 8. Modifying a Graph
- 9. Dynamic Graphing
- 10. Graphing a Recursion Formula
- 11. Graphing a Conic Section
- 12. Drawing Dots, Lines, and Text on the Graph Screen (Sketch)
- 13. Function Analysis
- Chapter 6 Statistical Graphs and Calculations
- 1. Before Performing Statistical Calculations
- 2. Calculating and Graphing Single-Variable Statistical Data
- 3. Calculating and Graphing Paired-Variable Statistical Data (Curve Fitting)
- 4. Performing Statistical Calculations
- 5. Tests
- 6. Confidence Interval
- 7. Distribution
- 8. Input and Output Terms of Tests, Confidence Interval, and Distribution
- 9. Statistic Formula
- Chapter 7 Financial Calculation
- Chapter 8 Programming
- Chapter 9 Spreadsheet
- Chapter 10 eActivity
- Chapter 11 Memory Manager
- Chapter 12 System Manager
- Chapter 13 Data Communication
- Chapter 14 Geometry
- Chapter 15 Picture Plot
- Chapter 16 3D Graph Function
- Appendix
- Examination Mode
- E-CON4 Application (English)
- 1. E-CON4 Mode Overview
- 2. Sampling Screen
- 3. Auto Sensor Detection (CLAB Only)
- 4. Selecting a Sensor
- 5. Configuring the Sampling Setup
- 6. Performing Auto Sensor Calibration and Zero Adjustment
- 7. Using a Custom Probe
- 8. Using Setup Memory
- 9. Starting a Sampling Operation
- 10. Using Sample Data Memory
- 11. Using the Graph Analysis Tools to Graph Data
- 12. Graph Analysis Tool Graph Screen Operations
- 13. Calling E-CON4 Functions from an eActivity
8-52
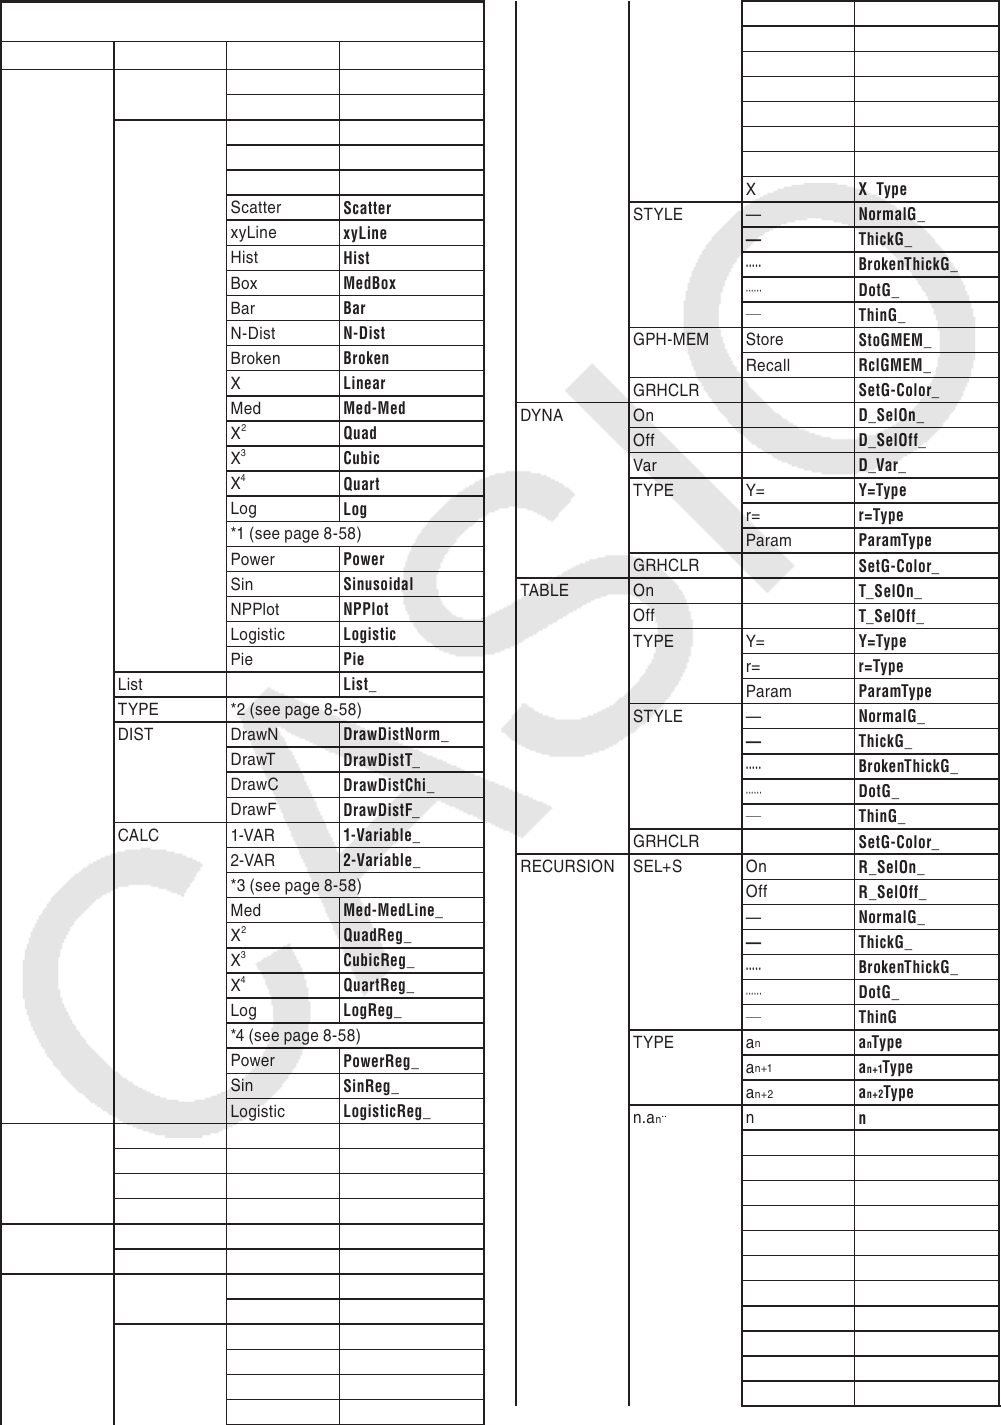
7. Program Mode Command List
RUN Program
4
(MENU) key
Level 1Level 2Level 3 Command
STAT DRAW On
DrawOn
Off
DrawOff
GRAPH S-Gph1
S-Gph1_
S-Gph2
S-Gph2_
S-Gph3
S-Gph3_
Scatter
Scatter
xyLine
xyLine
Hist
Hist
Box
MedBox
Bar
Bar
N-Dist
N-Dist
Broken
Broken
X
Linear
Med
Med-Med
X
2
Quad
X
3
Cubic
X
4
Quart
Log
Log
*1 (see page 8-58)
Power
Power
Sin
Sinusoidal
NPPlot
NPPlot
Logistic
Logistic
Pie
Pie
List
List_
TYPE *2 (see page 8-58)
DIST DrawN
DrawDistNorm_
DrawT
DrawDistT_
DrawC
DrawDistChi_
DrawF
DrawDistF_
CALC 1-VAR
1-Variable_
2-VAR
2-Variable_
*3 (see page 8-58)
Med
Med-MedLine_
X
2
QuadReg_
X
3
CubicReg_
X
4
QuartReg_
Log
LogReg_
*4 (see page 8-58)
Power
PowerReg_
Sin
SinReg_
Logistic
LogisticReg_
MAT Swap
Swap_
Row
`
Row_
Row+
`
Row+_
Row+
Row+_
LIST SortA
SortA(
SortD
SortD(
GRAPH SEL On
G_SelOn_
Off
G_SelOff_
TYPE Y=
Y=Type
r=
r=Type
Param
ParamType
X=
X=Type
Y>
Y>Type
Y<
Y<Type
Y
≥
Y
≥
≥
Type
Y
≤
Y
≤
Type
X>
X>Type
X<
X<Type
X
≥
X
≥
Type
X
≤
X
≤
Type
STYLE —
NormalG_
—
ThickG_
·····
BrokenThickG_
······
DotG_
—
ThinG_
GPH-MEM Store
StoGMEM_
Recall
RclGMEM_
GRHCLR
SetG-Color_
DYNA On
D_SelOn_
Off
D_SelOff_
Var
D_Var_
TYPE Y=
Y=Type
r=
r=Type
Param
ParamType
GRHCLR
SetG-Color_
TABLE On
T_SelOn_
Off
T_SelOff_
TYPE Y=
Y=Type
r=
r=Type
Param
ParamType
STYLE —
NormalG_
—
ThickG_
·····
BrokenThickG_
······
DotG_
—
ThinG_
GRHCLR
SetG-Color_
RECURSION SEL+S On
R_SelOn_
Off
R_SelOff_
—
NormalG_
—
ThickG_
·····
BrokenThickG_
······
DotG_
—
ThinG
TYPE a
n
a
n
Type
a
n+1
a
n+1
Type
a
n+2
a
n+2
Type
n.a
n
..
n
n
a
n
a
n
a
n+1
a
n+1
a
n+2
a
n+2
b
n
b
n
b
n+1
b
n+1
b
n+2
b
n+2
c
n
c
n
c
n+1
c
n+1
c
n+2
c
n+2
Σ
a
n
Σ
a
n
Σ
a
n+1
Σ
a
n+1