
User Manual
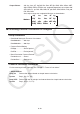
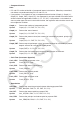
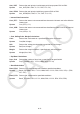
Table Of Contents
- Contents
- Getting Acquainted — Read This First!
- Chapter 1 Basic Operation
- Chapter 2 Manual Calculations
- 1. Basic Calculations
- 2. Special Functions
- 3. Specifying the Angle Unit and Display Format
- 4. Function Calculations
- 5. Numerical Calculations
- 6. Complex Number Calculations
- 7. Binary, Octal, Decimal, and Hexadecimal Calculations with Integers
- 8. Matrix Calculations
- 9. Vector Calculations
- 10. Metric Conversion Calculations
- Chapter 3 List Function
- Chapter 4 Equation Calculations
- Chapter 5 Graphing
- 1. Sample Graphs
- 2. Controlling What Appears on a Graph Screen
- 3. Drawing a Graph
- 4. Saving and Recalling Graph Screen Contents
- 5. Drawing Two Graphs on the Same Screen
- 6. Manual Graphing
- 7. Using Tables
- 8. Modifying a Graph
- 9. Dynamic Graphing
- 10. Graphing a Recursion Formula
- 11. Graphing a Conic Section
- 12. Drawing Dots, Lines, and Text on the Graph Screen (Sketch)
- 13. Function Analysis
- Chapter 6 Statistical Graphs and Calculations
- 1. Before Performing Statistical Calculations
- 2. Calculating and Graphing Single-Variable Statistical Data
- 3. Calculating and Graphing Paired-Variable Statistical Data (Curve Fitting)
- 4. Performing Statistical Calculations
- 5. Tests
- 6. Confidence Interval
- 7. Distribution
- 8. Input and Output Terms of Tests, Confidence Interval, and Distribution
- 9. Statistic Formula
- Chapter 7 Financial Calculation
- Chapter 8 Programming
- Chapter 9 Spreadsheet
- Chapter 10 eActivity
- Chapter 11 Memory Manager
- Chapter 12 System Manager
- Chapter 13 Data Communication
- Chapter 14 Geometry
- Chapter 15 Picture Plot
- Chapter 16 3D Graph Function
- Appendix
- Examination Mode
- E-CON4 Application (English)
- 1. E-CON4 Mode Overview
- 2. Sampling Screen
- 3. Auto Sensor Detection (CLAB Only)
- 4. Selecting a Sensor
- 5. Configuring the Sampling Setup
- 6. Performing Auto Sensor Calibration and Zero Adjustment
- 7. Using a Custom Probe
- 8. Using Setup Memory
- 9. Starting a Sampling Operation
- 10. Using Sample Data Memory
- 11. Using the Graph Analysis Tools to Graph Data
- 12. Graph Analysis Tool Graph Screen Operations
- 13. Calling E-CON4 Functions from an eActivity
8-48
•
2
Test
ChiGOFTest: Executes a chi-square goodness of fit test.
Syntax: ChiGOFTest List 1, List 2, df, List 3
(List 1 is the Observed list, List 2 is the Expected list, and List 3 is the
CNTRB list.)
Output Values:
2
, p , df are assigned respectively to the variables with the same names
and to ListAns elements 1 through 3. The CNTRB list is stored in List 3.
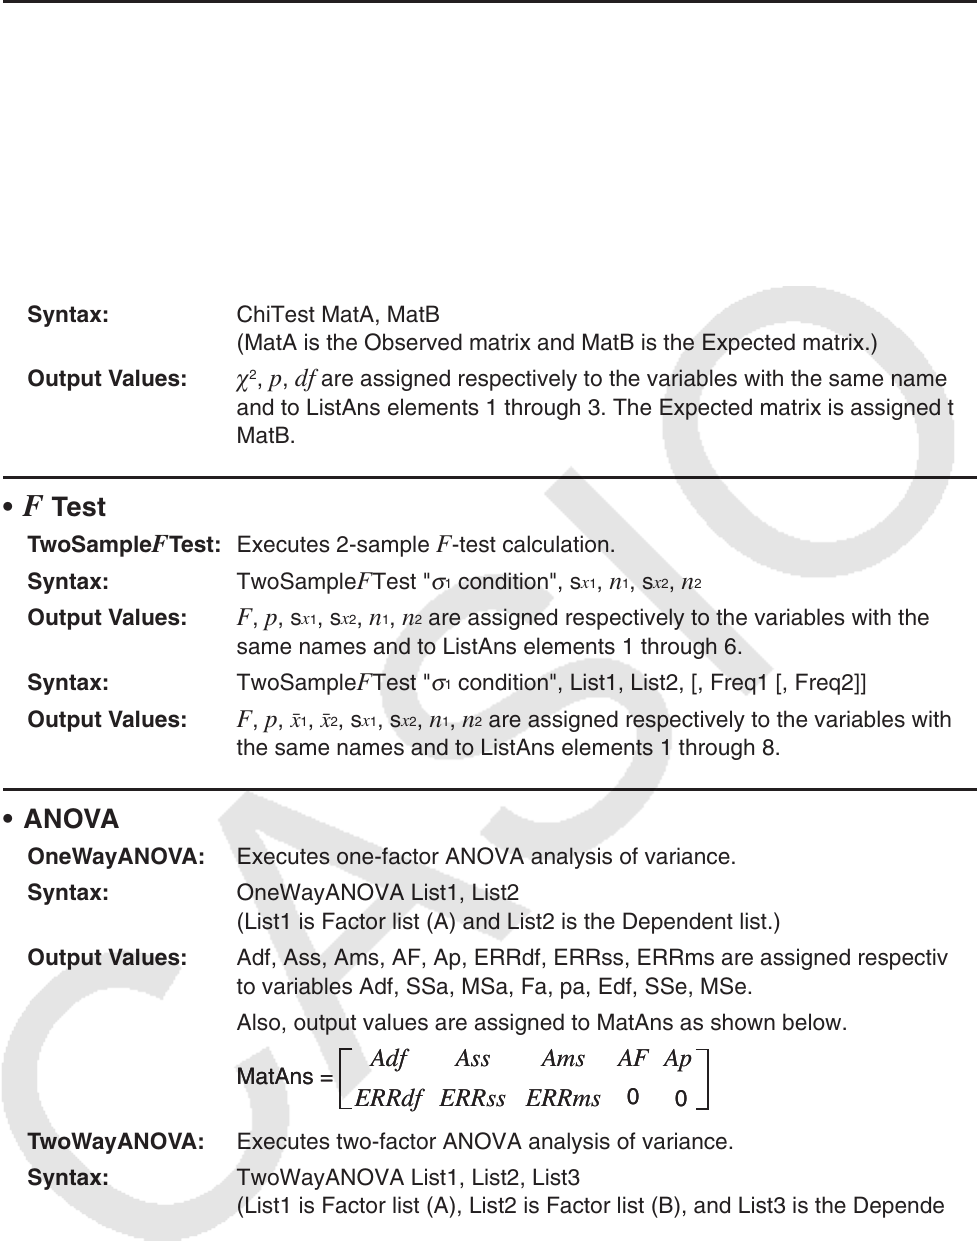
ChiTest: Executes a chi-square test.
Syntax: ChiTest MatA, MatB
(MatA is the Observed matrix and MatB is the Expected matrix.)
Output Values:
2
, p , df are assigned respectively to the variables with the same names
and to ListAns elements 1 through 3. The Expected matrix is assigned to
MatB.
• F Test
TwoSample F Test: Executes 2-sample F -test calculation.
Syntax: TwoSample
F Test "
σ
1
condition", s
x
1
, n
1
, s
x
2
, n
2
Output Values: F , p , s
x
1
, s
x
2
, n
1
, n
2
are assigned respectively to the variables with the
same names and to ListAns elements 1 through 6.
Syntax: TwoSample
F Test "
σ
1
condition", List1, List2, [, Freq1 [, Freq2]]
Output Values:
F , p , o
1
, o
2
, s
x
1
, s
x
2
, n
1
, n
2
are assigned respectively to the variables with
the same names and to ListAns elements 1 through 8.
• ANOVA
OneWayANOVA: Executes one-factor ANOVA analysis of variance.
Syntax: OneWayANOVA List1, List2
(List1 is Factor list (A) and List2 is the Dependent list.)
Output Values: Adf, Ass, Ams, AF, Ap, ERRdf, ERRss, ERRms are assigned respectively
to variables Adf, SSa, MSa, Fa, pa, Edf, SSe, MSe.
Also, output values are assigned to MatAns as shown below.
TwoWayANOVA: Executes two-factor ANOVA analysis of variance.
Syntax: TwoWayANOVA List1, List2, List3
(List1 is Factor list (A), List2 is Factor list (B), and List3 is the Dependent
list.)
MatAns =
Adf
ERRdf
Ass
ERRss
Ams
ERRms
AF
0
Ap
0
MatAns =
Adf
ERRdf
Ass
ERRss
Ams
ERRms
AF
0
Ap
0