
User Manual
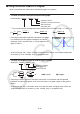
Table Of Contents
- Contents
- Getting Acquainted — Read This First!
- Chapter 1 Basic Operation
- Chapter 2 Manual Calculations
- 1. Basic Calculations
- 2. Special Functions
- 3. Specifying the Angle Unit and Display Format
- 4. Function Calculations
- 5. Numerical Calculations
- 6. Complex Number Calculations
- 7. Binary, Octal, Decimal, and Hexadecimal Calculations with Integers
- 8. Matrix Calculations
- 9. Vector Calculations
- 10. Metric Conversion Calculations
- Chapter 3 List Function
- Chapter 4 Equation Calculations
- Chapter 5 Graphing
- 1. Sample Graphs
- 2. Controlling What Appears on a Graph Screen
- 3. Drawing a Graph
- 4. Saving and Recalling Graph Screen Contents
- 5. Drawing Two Graphs on the Same Screen
- 6. Manual Graphing
- 7. Using Tables
- 8. Modifying a Graph
- 9. Dynamic Graphing
- 10. Graphing a Recursion Formula
- 11. Graphing a Conic Section
- 12. Drawing Dots, Lines, and Text on the Graph Screen (Sketch)
- 13. Function Analysis
- Chapter 6 Statistical Graphs and Calculations
- 1. Before Performing Statistical Calculations
- 2. Calculating and Graphing Single-Variable Statistical Data
- 3. Calculating and Graphing Paired-Variable Statistical Data (Curve Fitting)
- 4. Performing Statistical Calculations
- 5. Tests
- 6. Confidence Interval
- 7. Distribution
- 8. Input and Output Terms of Tests, Confidence Interval, and Distribution
- 9. Statistic Formula
- Chapter 7 Financial Calculation
- Chapter 8 Programming
- Chapter 9 Spreadsheet
- Chapter 10 eActivity
- Chapter 11 Memory Manager
- Chapter 12 System Manager
- Chapter 13 Data Communication
- Chapter 14 Geometry
- Chapter 15 Picture Plot
- Chapter 16 3D Graph Function
- Appendix
- Examination Mode
- E-CON4 Application (English)
- 1. E-CON4 Mode Overview
- 2. Sampling Screen
- 3. Auto Sensor Detection (CLAB Only)
- 4. Selecting a Sensor
- 5. Configuring the Sampling Setup
- 6. Performing Auto Sensor Calibration and Zero Adjustment
- 7. Using a Custom Probe
- 8. Using Setup Memory
- 9. Starting a Sampling Operation
- 10. Using Sample Data Memory
- 11. Using the Graph Analysis Tools to Graph Data
- 12. Graph Analysis Tool Graph Screen Operations
- 13. Calling E-CON4 Functions from an eActivity
8-36
k Using List Sort Functions in a Program
These functions let you sort data in lists into ascending or descending order.
• Ascending order
SortA (List 1, List 2, List 3)
Lists to be sorted (up to six can be specified)
• Descending order
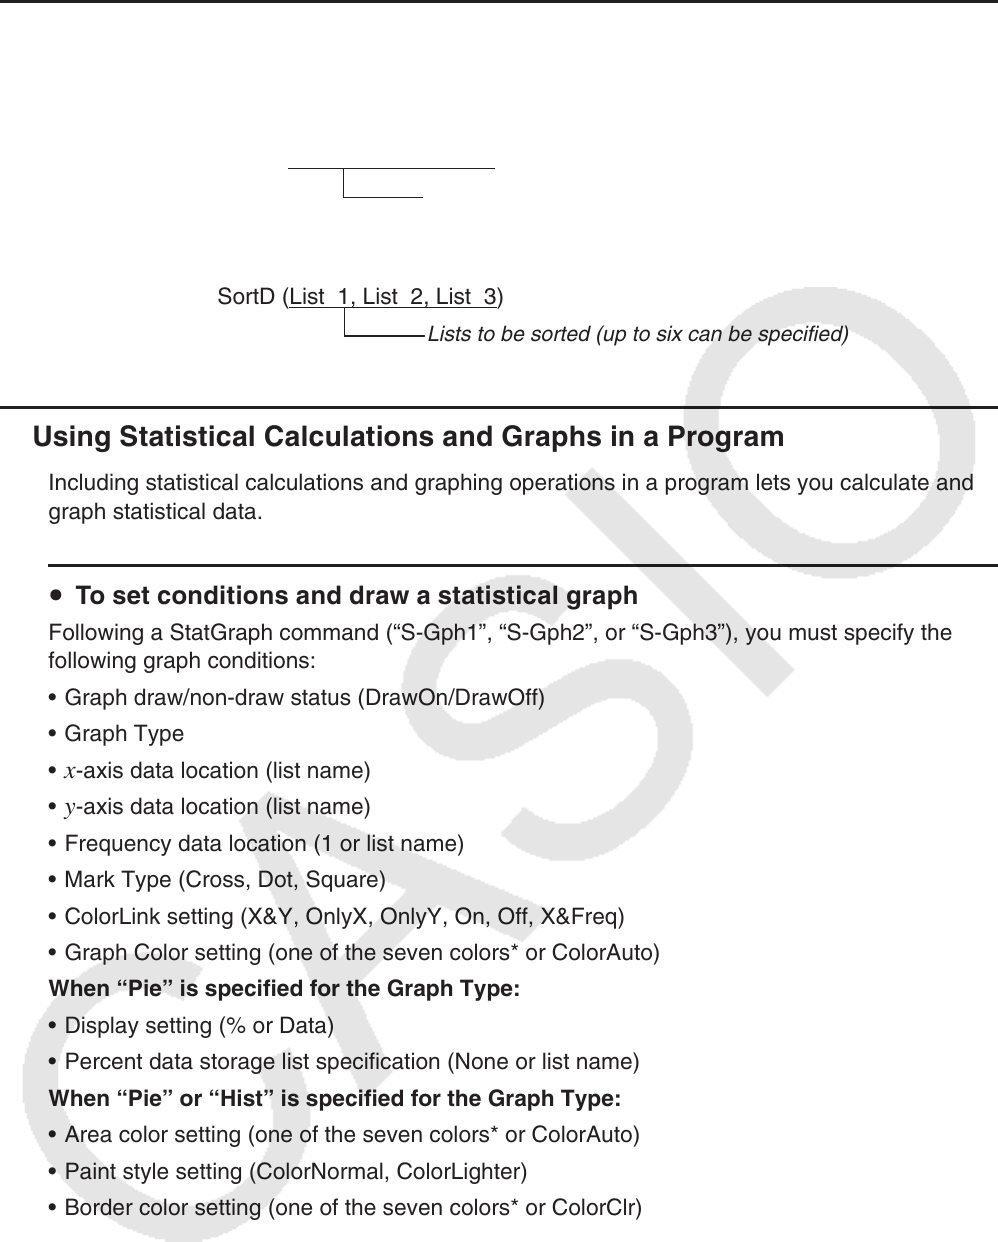
SortD (List 1, List 2, List 3)
Lists to be sorted (up to six can be specified)
k Using Statistical Calculations and Graphs in a Program
Including statistical calculations and graphing operations in a program lets you calculate and
graph statistical data.
u To set conditions and draw a statistical graph
Following a StatGraph command (“S-Gph1”, “S-Gph2”, or “S-Gph3”), you must specify the
following graph conditions:
• Graph draw/non-draw status (DrawOn/DrawOff)
• Graph Type
•
x-axis data location (list name)
•
y-axis data location (list name)
• Frequency data location (1 or list name)
• Mark Type
(Cross, Dot, Square)
• ColorLink setting (X&Y, OnlyX, OnlyY, On, Off, X&Freq)
• Graph Color setting (one of the seven colors* or ColorAuto)
When “Pie” is specified for the Graph Type:
• Display setting (% or Data)
• Percent data storage list specification (None or list name)
When “Pie” or “Hist” is specified for the Graph Type:
• Area color setting (one of the seven colors* or ColorAuto)
• Paint style setting (ColorNormal, ColorLighter)
• Border color setting (one of the seven colors* or ColorClr)