
User Manual
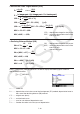
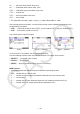
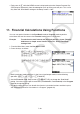
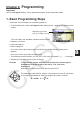
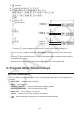

Table Of Contents
- Contents
- Getting Acquainted — Read This First!
- Chapter 1 Basic Operation
- Chapter 2 Manual Calculations
- 1. Basic Calculations
- 2. Special Functions
- 3. Specifying the Angle Unit and Display Format
- 4. Function Calculations
- 5. Numerical Calculations
- 6. Complex Number Calculations
- 7. Binary, Octal, Decimal, and Hexadecimal Calculations with Integers
- 8. Matrix Calculations
- 9. Vector Calculations
- 10. Metric Conversion Calculations
- Chapter 3 List Function
- Chapter 4 Equation Calculations
- Chapter 5 Graphing
- 1. Sample Graphs
- 2. Controlling What Appears on a Graph Screen
- 3. Drawing a Graph
- 4. Saving and Recalling Graph Screen Contents
- 5. Drawing Two Graphs on the Same Screen
- 6. Manual Graphing
- 7. Using Tables
- 8. Modifying a Graph
- 9. Dynamic Graphing
- 10. Graphing a Recursion Formula
- 11. Graphing a Conic Section
- 12. Drawing Dots, Lines, and Text on the Graph Screen (Sketch)
- 13. Function Analysis
- Chapter 6 Statistical Graphs and Calculations
- 1. Before Performing Statistical Calculations
- 2. Calculating and Graphing Single-Variable Statistical Data
- 3. Calculating and Graphing Paired-Variable Statistical Data (Curve Fitting)
- 4. Performing Statistical Calculations
- 5. Tests
- 6. Confidence Interval
- 7. Distribution
- 8. Input and Output Terms of Tests, Confidence Interval, and Distribution
- 9. Statistic Formula
- Chapter 7 Financial Calculation
- Chapter 8 Programming
- Chapter 9 Spreadsheet
- Chapter 10 eActivity
- Chapter 11 Memory Manager
- Chapter 12 System Manager
- Chapter 13 Data Communication
- Chapter 14 Geometry
- Chapter 15 Picture Plot
- Chapter 16 3D Graph Function
- Appendix
- Examination Mode
- E-CON4 Application (English)
- 1. E-CON4 Mode Overview
- 2. Sampling Screen
- 3. Auto Sensor Detection (CLAB Only)
- 4. Selecting a Sensor
- 5. Configuring the Sampling Setup
- 6. Performing Auto Sensor Calibration and Zero Adjustment
- 7. Using a Custom Probe
- 8. Using Setup Memory
- 9. Starting a Sampling Operation
- 10. Using Sample Data Memory
- 11. Using the Graph Analysis Tools to Graph Data
- 12. Graph Analysis Tool Graph Screen Operations
- 13. Calling E-CON4 Functions from an eActivity
8-4
u When you are inputting a program —— 2(BASE)
*
* Programs input after pressing 2(BASE) are indicated by
B
to the right of the file name.
• {TOP}/{BOTTOM}/{SEARCH}
• { MENU }
• { d~o } ... {decimal}/{hexadecimal}/{binary}/{octal} value input
• { LOGIC } ... {bitwise operator}
• { DISPLAY } ... conversion of displayed value to {decimal}/{hexadecimal}/{binary}/{octal}
• {A⇔a}/{SYMBOL}
• Pressing !J(PRGM) displays the following program (PRGM) menu.
• { Prog } ... {program recall}
• { JUMP } / { ? } / { ^}
• { RELATNL } ... {conditional jump relational operator menu}
• { : } ... {multi-statement command}
• Pressing !m(SET UP) displays the mode command menu shown below.
• {Dec}/{Hex}/{Bin}/{Oct}
• Pressing !f(FORMAT) displays the color command menu. For details, see “Using Color
Commands in a Program” (page 8-28).
3. Editing Program Contents
k Debugging a Program
A problem in a program that keeps the program from running correctly is called a “ bug”,
and the process of eliminating such problems is called “ debugging”. Either of the following
symptoms indicates that your program contains bugs that require debugging.
• Error messages appearing when the program is run
• Results that are not within your expectations
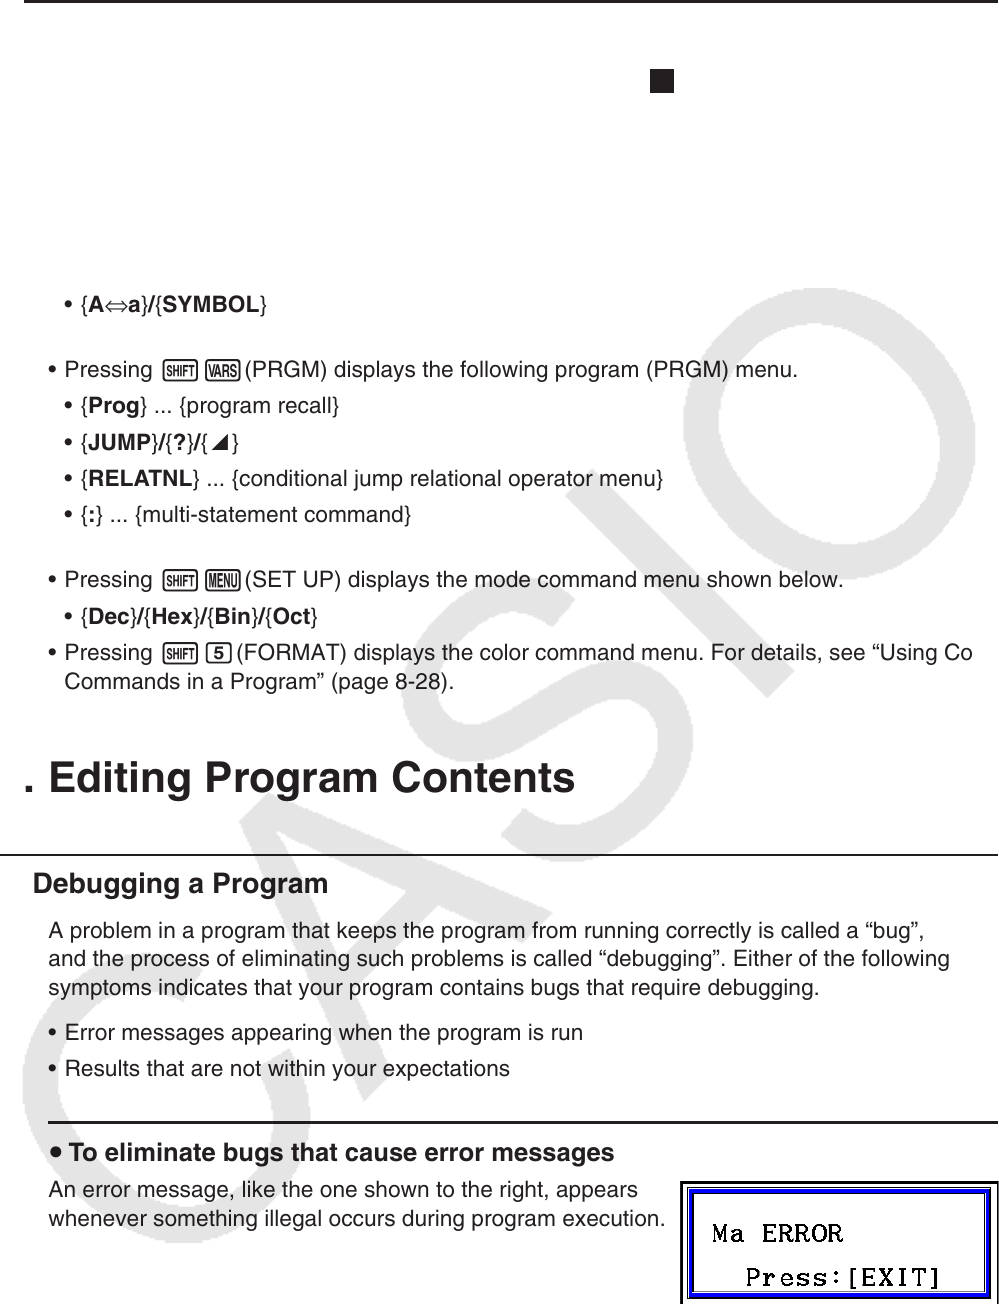
u To eliminate bugs that cause error messages
An error message, like the one shown to the right, appears
whenever something illegal occurs during program execution.
When such a message appears, press J to display the place in the program where the
error was caused. The cursor will be flashing at the location of the problem. Check the “Error
Message Table” (page
α
-1) for steps you should take to correct the situation.