
User Manual
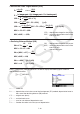
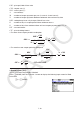
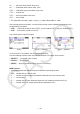
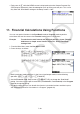
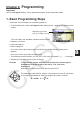
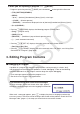

Table Of Contents
- Contents
- Getting Acquainted — Read This First!
- Chapter 1 Basic Operation
- Chapter 2 Manual Calculations
- 1. Basic Calculations
- 2. Special Functions
- 3. Specifying the Angle Unit and Display Format
- 4. Function Calculations
- 5. Numerical Calculations
- 6. Complex Number Calculations
- 7. Binary, Octal, Decimal, and Hexadecimal Calculations with Integers
- 8. Matrix Calculations
- 9. Vector Calculations
- 10. Metric Conversion Calculations
- Chapter 3 List Function
- Chapter 4 Equation Calculations
- Chapter 5 Graphing
- 1. Sample Graphs
- 2. Controlling What Appears on a Graph Screen
- 3. Drawing a Graph
- 4. Saving and Recalling Graph Screen Contents
- 5. Drawing Two Graphs on the Same Screen
- 6. Manual Graphing
- 7. Using Tables
- 8. Modifying a Graph
- 9. Dynamic Graphing
- 10. Graphing a Recursion Formula
- 11. Graphing a Conic Section
- 12. Drawing Dots, Lines, and Text on the Graph Screen (Sketch)
- 13. Function Analysis
- Chapter 6 Statistical Graphs and Calculations
- 1. Before Performing Statistical Calculations
- 2. Calculating and Graphing Single-Variable Statistical Data
- 3. Calculating and Graphing Paired-Variable Statistical Data (Curve Fitting)
- 4. Performing Statistical Calculations
- 5. Tests
- 6. Confidence Interval
- 7. Distribution
- 8. Input and Output Terms of Tests, Confidence Interval, and Distribution
- 9. Statistic Formula
- Chapter 7 Financial Calculation
- Chapter 8 Programming
- Chapter 9 Spreadsheet
- Chapter 10 eActivity
- Chapter 11 Memory Manager
- Chapter 12 System Manager
- Chapter 13 Data Communication
- Chapter 14 Geometry
- Chapter 15 Picture Plot
- Chapter 16 3D Graph Function
- Appendix
- Examination Mode
- E-CON4 Application (English)
- 1. E-CON4 Mode Overview
- 2. Sampling Screen
- 3. Auto Sensor Detection (CLAB Only)
- 4. Selecting a Sensor
- 5. Configuring the Sampling Setup
- 6. Performing Auto Sensor Calibration and Zero Adjustment
- 7. Using a Custom Probe
- 8. Using Setup Memory
- 9. Starting a Sampling Operation
- 10. Using Sample Data Memory
- 11. Using the Graph Analysis Tools to Graph Data
- 12. Graph Analysis Tool Graph Screen Operations
- 13. Calling E-CON4 Functions from an eActivity
7-20
• Each press of w while the MEMO screen is displayed cycles the Coupon Payment Day
(CPD) display sequentially from the redemption year up to the purchase year. This is true
only when the “Date Mode” setting on the Setup screen is “365”.
11. Financial Calculations Using Functions
You can use special functions in the Run-Matrix mode or Program mode to perform
calculations that are the same as the Financial mode financial calculations.
Example To calculate the total interest and principal paid for a 2-year (730-day)
$300 loan at a simple annual interest rate of 5%. Use a Date Mode
setting of 365.
1. From the Main Menu, enter the Run-Matrix mode.
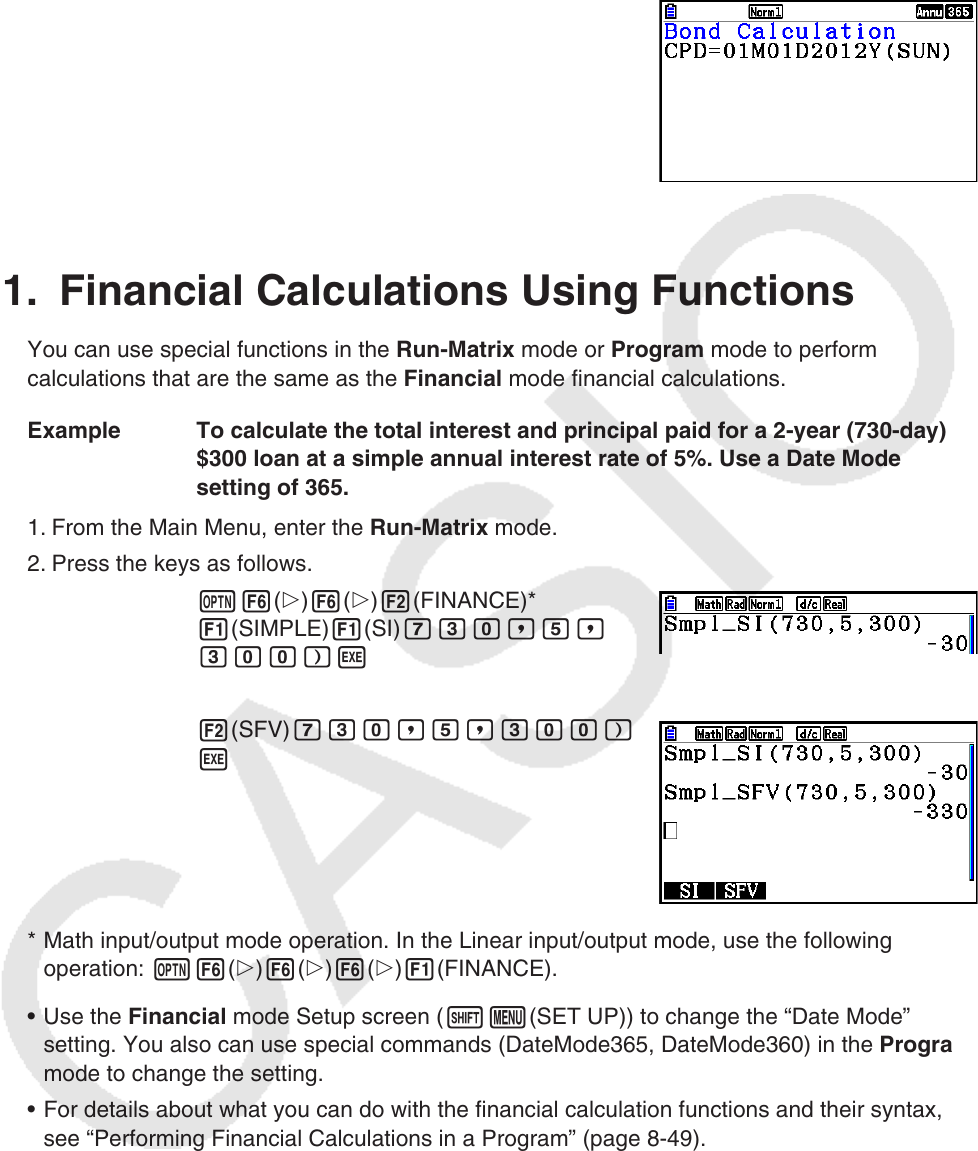
2. Press the keys as follows.
K6(g)6(g)2(FINANCE)*
1(SIMPLE)1(SI)hda,f,
daa)w
2(SFV) hda,f,daa)
w
* Math input/output mode operation. In the Linear input/output mode, use the following
operation: K6(g)6(g)6(g)1(FINANCE).
• Use the Financial mode Setup screen (!m(SET UP)) to change the “Date Mode”
setting. You also can use special commands (DateMode365, DateMode360) in the Program
mode to change the setting.
• For details about what you can do with the financial calculation functions and their syntax,
see “Performing Financial Calculations in a Program” (page 8-49).