
User Manual
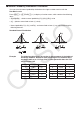
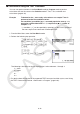


Table Of Contents
- Contents
- Getting Acquainted — Read This First!
- Chapter 1 Basic Operation
- Chapter 2 Manual Calculations
- 1. Basic Calculations
- 2. Special Functions
- 3. Specifying the Angle Unit and Display Format
- 4. Function Calculations
- 5. Numerical Calculations
- 6. Complex Number Calculations
- 7. Binary, Octal, Decimal, and Hexadecimal Calculations with Integers
- 8. Matrix Calculations
- 9. Vector Calculations
- 10. Metric Conversion Calculations
- Chapter 3 List Function
- Chapter 4 Equation Calculations
- Chapter 5 Graphing
- 1. Sample Graphs
- 2. Controlling What Appears on a Graph Screen
- 3. Drawing a Graph
- 4. Saving and Recalling Graph Screen Contents
- 5. Drawing Two Graphs on the Same Screen
- 6. Manual Graphing
- 7. Using Tables
- 8. Modifying a Graph
- 9. Dynamic Graphing
- 10. Graphing a Recursion Formula
- 11. Graphing a Conic Section
- 12. Drawing Dots, Lines, and Text on the Graph Screen (Sketch)
- 13. Function Analysis
- Chapter 6 Statistical Graphs and Calculations
- 1. Before Performing Statistical Calculations
- 2. Calculating and Graphing Single-Variable Statistical Data
- 3. Calculating and Graphing Paired-Variable Statistical Data (Curve Fitting)
- 4. Performing Statistical Calculations
- 5. Tests
- 6. Confidence Interval
- 7. Distribution
- 8. Input and Output Terms of Tests, Confidence Interval, and Distribution
- 9. Statistic Formula
- Chapter 7 Financial Calculation
- Chapter 8 Programming
- Chapter 9 Spreadsheet
- Chapter 10 eActivity
- Chapter 11 Memory Manager
- Chapter 12 System Manager
- Chapter 13 Data Communication
- Chapter 14 Geometry
- Chapter 15 Picture Plot
- Chapter 16 3D Graph Function
- Appendix
- Examination Mode
- E-CON4 Application (English)
- 1. E-CON4 Mode Overview
- 2. Sampling Screen
- 3. Auto Sensor Detection (CLAB Only)
- 4. Selecting a Sensor
- 5. Configuring the Sampling Setup
- 6. Performing Auto Sensor Calibration and Zero Adjustment
- 7. Using a Custom Probe
- 8. Using Setup Memory
- 9. Starting a Sampling Operation
- 10. Using Sample Data Memory
- 11. Using the Graph Analysis Tools to Graph Data
- 12. Graph Analysis Tool Graph Screen Operations
- 13. Calling E-CON4 Functions from an eActivity
6-33
5. Tests
The Z Test provides a variety of different standardization-based tests. They make it possible to
test whether or not a sample accurately represents the population when the standard deviation
of a population (such as the entire population of a country) is known from previous tests.
Z
testing is used for market research and public opinion research, that need to be performed
repeatedly.
1-Sample
Z Test tests for the unknown population mean when the population standard
deviation is known.
2-Sample
Z Test tests the equality of the means of two populations based on independent
samples when both population standard deviations are known.
1-Prop
Z Test tests for an unknown proportion of successes.
2-Prop
Z Test tests to compare the proportion of successes from two populations.
The t Test tests the hypothesis when the population standard deviation is unknown. The
hypothesis that is the opposite of the hypothesis being proven is called the null hypothesis ,
while the hypothesis being proved is called the alternative hypothesis . The
t Test is normally
applied to test the null hypothesis. Then a determination is made whether the null hypothesis
or alternative hypothesis will be adopted.
1-Sample
t Test tests the hypothesis for a single unknown population mean when the
population standard deviation is unknown.
2-Sample
t Test compares the population means when the population standard deviations are
unknown.
LinearReg
t Test calculates the strength of the linear association of paired data.
With the
χ
χ
2
test , a number of independent groups are provided and a hypothesis is tested
relative to the probability of samples being included in each group.
The
χ
χ
2
GOF test ( χ
2
one-way Test) tests whether the observed count of sample data fits
a certain distribution. For example, it can be used to determine conformance with normal
distribution or binomial distribution.
The
χ
χ
2
two-way test creates a cross-tabulation table that structures mainly two qualitative
variables (such as “Yes” and “No”), and evaluates the independence of the variables.
2-Sample F Test tests the hypothesis for the ratio of sample variances. It could be used, for
example, to test the carcinogenic effects of multiple suspected factors such as tobacco use,
alcohol, vitamin deficiency, high coffee intake, inactivity, poor living habits, etc.
ANOVA tests the hypothesis that the population means of the samples are equal when
there are multiple samples. It could be used, for example, to test whether or not different
combinations of materials have an effect on the quality and life of a final product.
One-Way ANOVA is used when there is one independent variable and one dependent
variable.
Two-Way ANOVA is used when there are two independent variables and one dependent
variable.