
User Manual
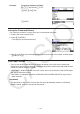
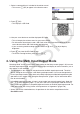
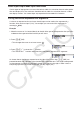
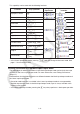
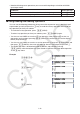
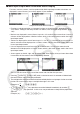
Table Of Contents
- Contents
- Getting Acquainted — Read This First!
- Chapter 1 Basic Operation
- Chapter 2 Manual Calculations
- 1. Basic Calculations
- 2. Special Functions
- 3. Specifying the Angle Unit and Display Format
- 4. Function Calculations
- 5. Numerical Calculations
- 6. Complex Number Calculations
- 7. Binary, Octal, Decimal, and Hexadecimal Calculations with Integers
- 8. Matrix Calculations
- 9. Vector Calculations
- 10. Metric Conversion Calculations
- Chapter 3 List Function
- Chapter 4 Equation Calculations
- Chapter 5 Graphing
- 1. Sample Graphs
- 2. Controlling What Appears on a Graph Screen
- 3. Drawing a Graph
- 4. Saving and Recalling Graph Screen Contents
- 5. Drawing Two Graphs on the Same Screen
- 6. Manual Graphing
- 7. Using Tables
- 8. Modifying a Graph
- 9. Dynamic Graphing
- 10. Graphing a Recursion Formula
- 11. Graphing a Conic Section
- 12. Drawing Dots, Lines, and Text on the Graph Screen (Sketch)
- 13. Function Analysis
- Chapter 6 Statistical Graphs and Calculations
- 1. Before Performing Statistical Calculations
- 2. Calculating and Graphing Single-Variable Statistical Data
- 3. Calculating and Graphing Paired-Variable Statistical Data (Curve Fitting)
- 4. Performing Statistical Calculations
- 5. Tests
- 6. Confidence Interval
- 7. Distribution
- 8. Input and Output Terms of Tests, Confidence Interval, and Distribution
- 9. Statistic Formula
- Chapter 7 Financial Calculation
- Chapter 8 Programming
- Chapter 9 Spreadsheet
- Chapter 10 eActivity
- Chapter 11 Memory Manager
- Chapter 12 System Manager
- Chapter 13 Data Communication
- Chapter 14 Geometry
- Chapter 15 Picture Plot
- Chapter 16 3D Graph Function
- Appendix
- Examination Mode
- E-CON4 Application (English)
- 1. E-CON4 Mode Overview
- 2. Sampling Screen
- 3. Auto Sensor Detection (CLAB Only)
- 4. Selecting a Sensor
- 5. Configuring the Sampling Setup
- 6. Performing Auto Sensor Calibration and Zero Adjustment
- 7. Using a Custom Probe
- 8. Using Setup Memory
- 9. Starting a Sampling Operation
- 10. Using Sample Data Memory
- 11. Using the Graph Analysis Tools to Graph Data
- 12. Graph Analysis Tool Graph Screen Operations
- 13. Calling E-CON4 Functions from an eActivity
1-15
1. Select a command that is included in the online manual.
This causes 2(QR) to appear in the function menu. •
2. Press 2(QR).
This displays a QR Code.•
3. Use your smart device to read the displayed QR Code.
This will display the online manual on your smart device.
For information about how to read a QR Code, refer to the user documentation of your
smart device and the QR Code reader you are using.
If you are having trouble reading the QR Code, use d and e to adjust display
brightness.
4. Press J to close the QR Code screen.
To exit the Catalog function, press A or !J.
4. Using the Math Input/Output Mode
Selecting “Math” for the “Input/Output” mode setting on the Setup screen (page 1-35) turns on
the Math input/output mode, which allows natural input and display of certain functions, just as
they appear in your textbook.
• The operations in this section all are performed in the Math input/output mode. The initial
default setting for this calculator is the Math input/output mode. If you have changed to the
Linear input/output mode, switch back to the Math input/output mode before performing the
operations in this section. See “Using the Setup Screen” (page
1-35) for information about
how to switch modes.
• In the Math input/output mode, all input is insert mode (not overwrite mode) input. Note that
the !D(INS) operation (page 1-7) you use in the Linear input/output mode to switch to
insert mode input performs a completely different function in the Math input/output mode. For
more information, see “Using Values and Expressions as Arguments” (page
1-20).
• Unless specifically stated otherwise, all operations in this section are performed in the
Run-Matrix mode.
•
•
•
•