
User Manual
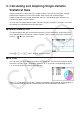
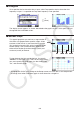
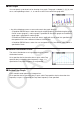
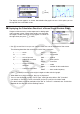
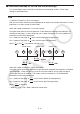
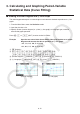
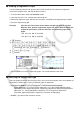
Table Of Contents
- Contents
- Getting Acquainted — Read This First!
- Chapter 1 Basic Operation
- Chapter 2 Manual Calculations
- 1. Basic Calculations
- 2. Special Functions
- 3. Specifying the Angle Unit and Display Format
- 4. Function Calculations
- 5. Numerical Calculations
- 6. Complex Number Calculations
- 7. Binary, Octal, Decimal, and Hexadecimal Calculations with Integers
- 8. Matrix Calculations
- 9. Vector Calculations
- 10. Metric Conversion Calculations
- Chapter 3 List Function
- Chapter 4 Equation Calculations
- Chapter 5 Graphing
- 1. Sample Graphs
- 2. Controlling What Appears on a Graph Screen
- 3. Drawing a Graph
- 4. Saving and Recalling Graph Screen Contents
- 5. Drawing Two Graphs on the Same Screen
- 6. Manual Graphing
- 7. Using Tables
- 8. Modifying a Graph
- 9. Dynamic Graphing
- 10. Graphing a Recursion Formula
- 11. Graphing a Conic Section
- 12. Drawing Dots, Lines, and Text on the Graph Screen (Sketch)
- 13. Function Analysis
- Chapter 6 Statistical Graphs and Calculations
- 1. Before Performing Statistical Calculations
- 2. Calculating and Graphing Single-Variable Statistical Data
- 3. Calculating and Graphing Paired-Variable Statistical Data (Curve Fitting)
- 4. Performing Statistical Calculations
- 5. Tests
- 6. Confidence Interval
- 7. Distribution
- 8. Input and Output Terms of Tests, Confidence Interval, and Distribution
- 9. Statistic Formula
- Chapter 7 Financial Calculation
- Chapter 8 Programming
- Chapter 9 Spreadsheet
- Chapter 10 eActivity
- Chapter 11 Memory Manager
- Chapter 12 System Manager
- Chapter 13 Data Communication
- Chapter 14 Geometry
- Chapter 15 Picture Plot
- Chapter 16 3D Graph Function
- Appendix
- Examination Mode
- E-CON4 Application (English)
- 1. E-CON4 Mode Overview
- 2. Sampling Screen
- 3. Auto Sensor Detection (CLAB Only)
- 4. Selecting a Sensor
- 5. Configuring the Sampling Setup
- 6. Performing Auto Sensor Calibration and Zero Adjustment
- 7. Using a Custom Probe
- 8. Using Setup Memory
- 9. Starting a Sampling Operation
- 10. Using Sample Data Memory
- 11. Using the Graph Analysis Tools to Graph Data
- 12. Graph Analysis Tool Graph Screen Operations
- 13. Calling E-CON4 Functions from an eActivity
6-15
3. Calculating and Graphing Paired-Variable
Statistical Data (Curve Fitting)
k Drawing a Scatter Diagram and xy Line Graph
The following procedure plots a scatter diagram and connects the dots to produce an xy line
graph.
1. From the Main Menu, enter the Statistics mode.
2. Input the data into a list.
3. Specify Scatter (scatter diagram) or
xy Line ( xy line graph) as the graph type, and then
execute the graph operation.
Press A, J or !J(QUIT) to return to the List Editor.
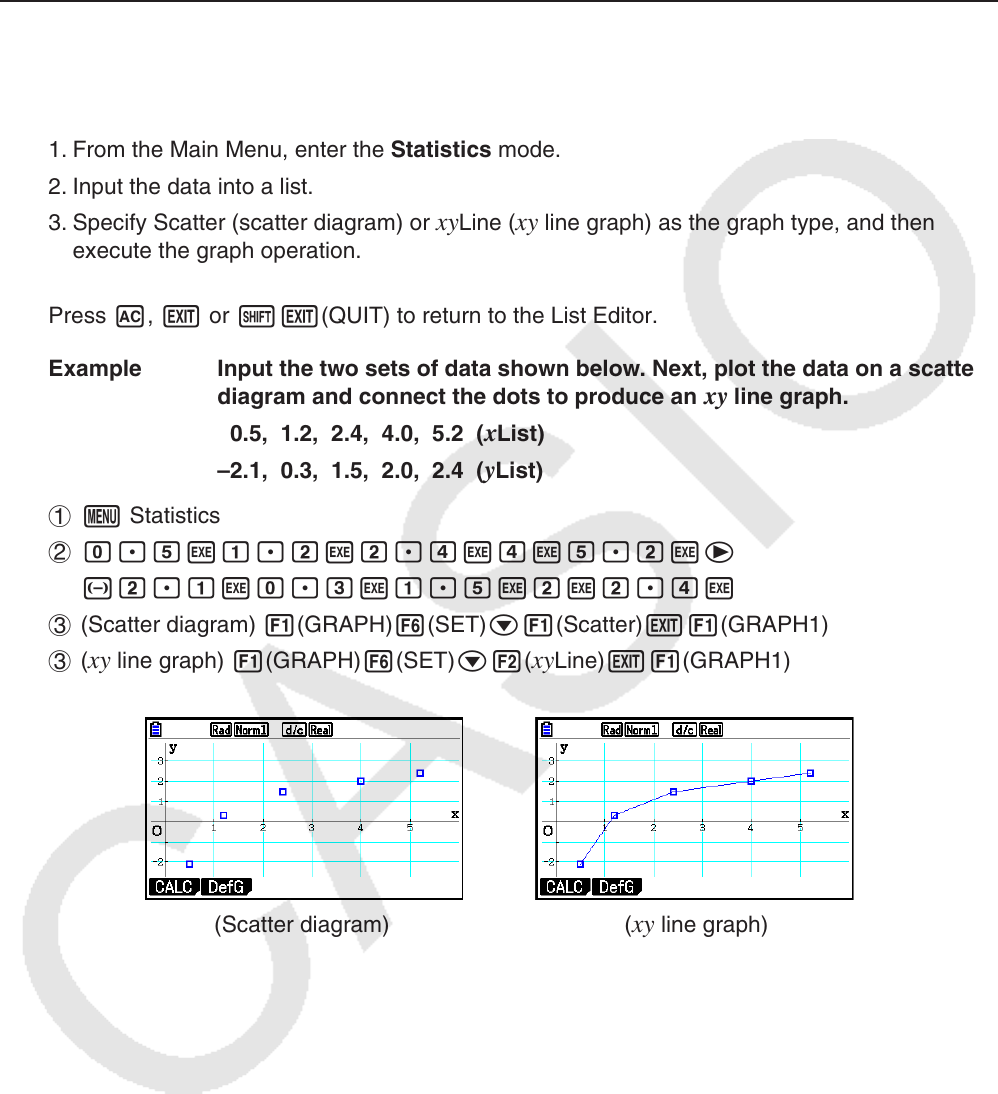
Example Input the two sets of data shown below. Next, plot the data on a scatter
diagram and connect the dots to produce an
xy line graph.
0.5, 1.2, 2.4, 4.0, 5.2 ( x List)
–2.1, 0.3, 1.5, 2.0, 2.4 (
y List)
1 m Statistics
2 a.fwb.cwc.ewewf.cwe
-c.bwa.dwb.fwcwc.ew
3 (Scatter diagram) 1(GRAPH) 6(SET) c1(Scatter) J1(GRAPH1)
3 (
xy line graph) 1(GRAPH) 6(SET) c2( xy Line) J1(GRAPH1)
(Scatter diagram) (
xy line graph)