
User Manual
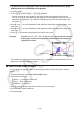
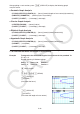
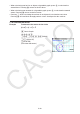
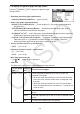
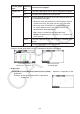
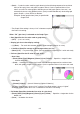
Table Of Contents
- Contents
- Getting Acquainted — Read This First!
- Chapter 1 Basic Operation
- Chapter 2 Manual Calculations
- 1. Basic Calculations
- 2. Special Functions
- 3. Specifying the Angle Unit and Display Format
- 4. Function Calculations
- 5. Numerical Calculations
- 6. Complex Number Calculations
- 7. Binary, Octal, Decimal, and Hexadecimal Calculations with Integers
- 8. Matrix Calculations
- 9. Vector Calculations
- 10. Metric Conversion Calculations
- Chapter 3 List Function
- Chapter 4 Equation Calculations
- Chapter 5 Graphing
- 1. Sample Graphs
- 2. Controlling What Appears on a Graph Screen
- 3. Drawing a Graph
- 4. Saving and Recalling Graph Screen Contents
- 5. Drawing Two Graphs on the Same Screen
- 6. Manual Graphing
- 7. Using Tables
- 8. Modifying a Graph
- 9. Dynamic Graphing
- 10. Graphing a Recursion Formula
- 11. Graphing a Conic Section
- 12. Drawing Dots, Lines, and Text on the Graph Screen (Sketch)
- 13. Function Analysis
- Chapter 6 Statistical Graphs and Calculations
- 1. Before Performing Statistical Calculations
- 2. Calculating and Graphing Single-Variable Statistical Data
- 3. Calculating and Graphing Paired-Variable Statistical Data (Curve Fitting)
- 4. Performing Statistical Calculations
- 5. Tests
- 6. Confidence Interval
- 7. Distribution
- 8. Input and Output Terms of Tests, Confidence Interval, and Distribution
- 9. Statistic Formula
- Chapter 7 Financial Calculation
- Chapter 8 Programming
- Chapter 9 Spreadsheet
- Chapter 10 eActivity
- Chapter 11 Memory Manager
- Chapter 12 System Manager
- Chapter 13 Data Communication
- Chapter 14 Geometry
- Chapter 15 Picture Plot
- Chapter 16 3D Graph Function
- Appendix
- Examination Mode
- E-CON4 Application (English)
- 1. E-CON4 Mode Overview
- 2. Sampling Screen
- 3. Auto Sensor Detection (CLAB Only)
- 4. Selecting a Sensor
- 5. Configuring the Sampling Setup
- 6. Performing Auto Sensor Calibration and Zero Adjustment
- 7. Using a Custom Probe
- 8. Using Setup Memory
- 9. Starting a Sampling Operation
- 10. Using Sample Data Memory
- 11. Using the Graph Analysis Tools to Graph Data
- 12. Graph Analysis Tool Graph Screen Operations
- 13. Calling E-CON4 Functions from an eActivity
6-2
k General Graph Settings [GRAPH]-[SET]
This section describes how to use the general graph settings screen to make the following
settings for each graph (GRAPH1, GRAPH2, GRAPH3).
• Graph Type
The initial default graph type setting for all the graphs is scatter graph. You can select one of a
variety of other statistical graph types for each graph.
• XList, YList
The initial default statistical data is List 1 for single-variable data, and List 1 and List 2 for
paired-variable data. You can specify which statistical data list you want to use for
x-data and
y-data.
• Frequency
This setting specifies a list that contains frequency data.
In statistics, “frequency” means the number of times a data item (or set of data items) occurs.
Frequencies are used in “frequency distribution tables,” which list each unique data item in
one column, with the frequency (number of occurrences) in the column to the right. With this
calculator, the data column and frequency column are separate lists. This setting specifies the
list (List 1, List 2, etc.) to be used for the frequency column when drawing a statistical graph.
The initial default setting for this item is 1, which indicates that the frequency of all data items
is 1 (one occurrence).
Important!
• The values contained in a frequency list should be 0 or positive values only. Even a single
negative value will cause an error (Out of Domain).
• Statistical data with a frequency of 0 is not used for calculation of minimum and maximum
values.
• Mark Type
This setting lets you specify the shape of the plot points on the graph.
• Color Link
This setting specifies whether the color specified on the List Editor for the statistical data list(s)
to be used for graphing should be applied as the graph color(s). The initial default value is “Off”
(color specified with the List Editor not applied to the graph).
• Graph Color
Specifies the graph color when “Off” is selected for the Color Link setting. Depending on the
graph type, setting items for specifying the color of each part of a graph may appear in place
of this item. In the case of a pie chart, for example, Pie Area and Pie Border color settings will
appear.