
User Manual
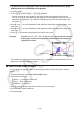
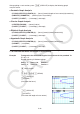
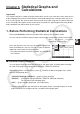
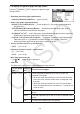
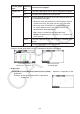
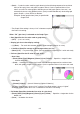
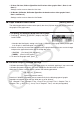
Table Of Contents
- Contents
- Getting Acquainted — Read This First!
- Chapter 1 Basic Operation
- Chapter 2 Manual Calculations
- 1. Basic Calculations
- 2. Special Functions
- 3. Specifying the Angle Unit and Display Format
- 4. Function Calculations
- 5. Numerical Calculations
- 6. Complex Number Calculations
- 7. Binary, Octal, Decimal, and Hexadecimal Calculations with Integers
- 8. Matrix Calculations
- 9. Vector Calculations
- 10. Metric Conversion Calculations
- Chapter 3 List Function
- Chapter 4 Equation Calculations
- Chapter 5 Graphing
- 1. Sample Graphs
- 2. Controlling What Appears on a Graph Screen
- 3. Drawing a Graph
- 4. Saving and Recalling Graph Screen Contents
- 5. Drawing Two Graphs on the Same Screen
- 6. Manual Graphing
- 7. Using Tables
- 8. Modifying a Graph
- 9. Dynamic Graphing
- 10. Graphing a Recursion Formula
- 11. Graphing a Conic Section
- 12. Drawing Dots, Lines, and Text on the Graph Screen (Sketch)
- 13. Function Analysis
- Chapter 6 Statistical Graphs and Calculations
- 1. Before Performing Statistical Calculations
- 2. Calculating and Graphing Single-Variable Statistical Data
- 3. Calculating and Graphing Paired-Variable Statistical Data (Curve Fitting)
- 4. Performing Statistical Calculations
- 5. Tests
- 6. Confidence Interval
- 7. Distribution
- 8. Input and Output Terms of Tests, Confidence Interval, and Distribution
- 9. Statistic Formula
- Chapter 7 Financial Calculation
- Chapter 8 Programming
- Chapter 9 Spreadsheet
- Chapter 10 eActivity
- Chapter 11 Memory Manager
- Chapter 12 System Manager
- Chapter 13 Data Communication
- Chapter 14 Geometry
- Chapter 15 Picture Plot
- Chapter 16 3D Graph Function
- Appendix
- Examination Mode
- E-CON4 Application (English)
- 1. E-CON4 Mode Overview
- 2. Sampling Screen
- 3. Auto Sensor Detection (CLAB Only)
- 4. Selecting a Sensor
- 5. Configuring the Sampling Setup
- 6. Performing Auto Sensor Calibration and Zero Adjustment
- 7. Using a Custom Probe
- 8. Using Setup Memory
- 9. Starting a Sampling Operation
- 10. Using Sample Data Memory
- 11. Using the Graph Analysis Tools to Graph Data
- 12. Graph Analysis Tool Graph Screen Operations
- 13. Calling E-CON4 Functions from an eActivity
5-62
After graphing a conic section, press !5(G-SOLVE) to display the following graph
analysis menus.
u Parabolic Graph Analysis
• { FOCUS } / { VERTEX } / { LENGTH } / { e } ... {focus}/{vertex}/{length of latus rectum}/{eccentricity}
• { DIRECTX } / { SYMMETRY } ... {directrix}/{axis of symmetry}
• { X-ICEPT } / { Y-ICEPT } ... {
x -intercept}/{ y -intercept}
u Circular Graph Analysis
• { CENTER } / { RADIUS } ... {center}/{radius}
• { X-ICEPT } / { Y-ICEPT } ... {
x -intercept}/{ y -intercept}
u Elliptical Graph Analysis
• { FOCUS } / { VERTEX } / { CENTER } / { e } ... {focus}/{vertex}/{center}/{eccentricity}
• { X-ICEPT } / { Y-ICEPT } ... {
x -intercept}/{ y -intercept}
u Hyperbolic Graph Analysis
• { FOCUS } / { VERTEX } / { CENTER } / { e } ... {focus}/{vertex}/{center}/{eccentricity}
• { ASYMPT } ... {asymptote}
• { X-ICEPT } / { Y-ICEPT } ... {
x -intercept}/{ y -intercept}
u To calculate the focus and length of latus rectum
Example To determine the focus and length of latus rectum for the parabola X =
(Y – 2)
2
+ 3
Use the following V-Window settings.
Xmin = –1, Xmax = 10, Xscale = 1
Ymin = –5, Ymax = 5, Yscale = 1
m Conic Graphs
w
bwcwdw6(DRAW)
!5(G-SOLVE)
1(FOCUS)
(Calculates the focus.)
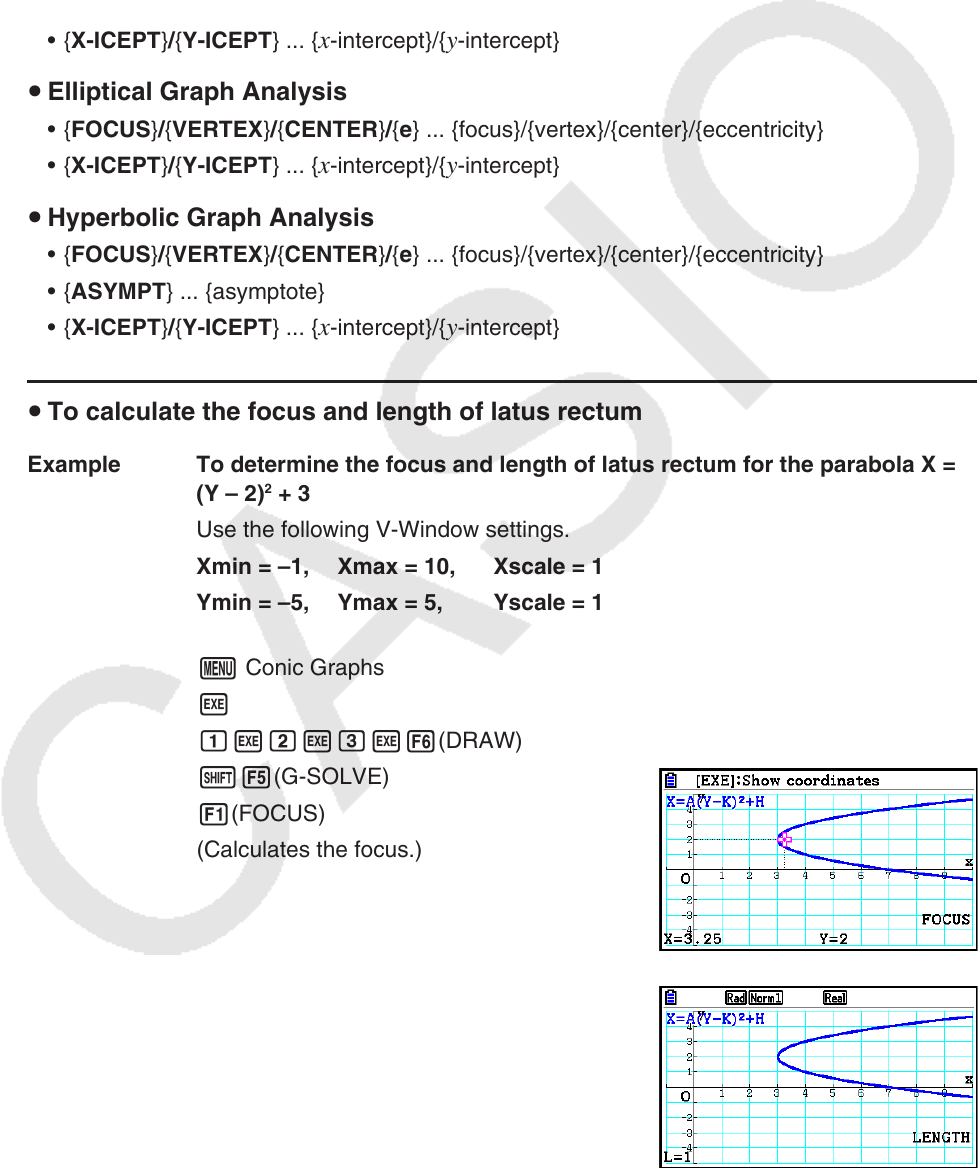
!5(G-SOLVE)
5(LENGTH)
(Calculates the length of latus rectum.)